Siren is trading at $0.02802 right now, and this chart honestly tells a pretty interesting story if you look at it closely. This Siren price prediction walks through exactly what's happening
Siren is trading at $0.02802 right now, and this chart honestly tells a pretty interesting story if you look at it closely.
This Siren price prediction walks through exactly what's happening on the chart and where the price could head next.
Siren coin Price And Market Overview Right Now
Metric
Value
Price
$0.02802
24h Change
-12.83% (-$0.00418)
Market Cap
$24.26M
Futures Volume (24h)
$33.05M
Spot Volume (24h)
$392.36K
Open Interest
$25.72M
Circulating Supply
724.05M
Total Supply
724.05M
Max Supply
Not capped
Even with the price down sharply over the last day, futures volume is $33.05M against a spot volume of just $392.36K.
The much larger futures volume compared with spot volume suggests derivatives traders are currently driving most of the short-term activity, not spot buyers, which usually means bigger swings in both directions.
Siren Liquidation Data Shows Longs Under Heavy Pressure
Almost every single liquidation over the past several hours has come from long positions, which lines up with the sharp 12.83% drop.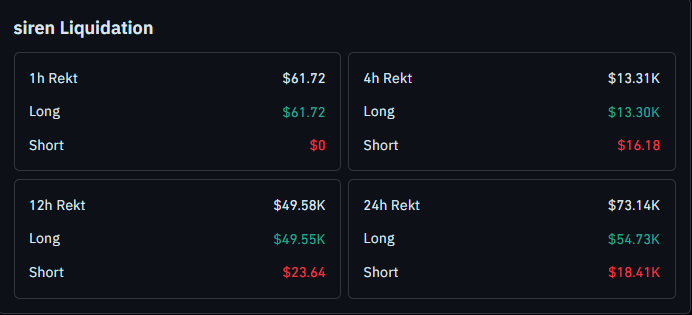
This tells you traders who were betting on the price holding up got caught off guard as Siren slid down. Binance is doing the heavy lifting on volume here too, handling $20.15M of futures trading, well ahead of Bybit at $3.67M and BingX at $2.89M.
Why Siren Holder Concentration Is Worth Watching Closely
Before getting into the chart, there's something in the holder data that's worth flagging. 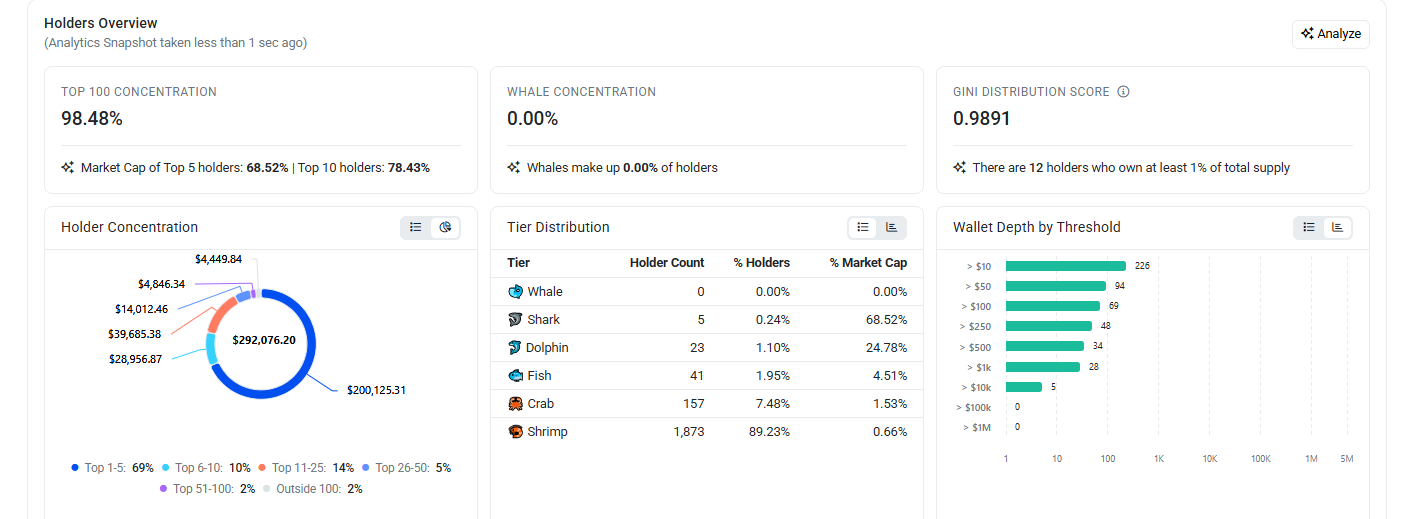
The top 100 wallets currently hold 98.48% of the total supply, and just the top five wallets control 68.52% of the circulating supply. 68.52% of the market cap.
There are 12 wallets holding at least 1% of the entire supply each, and the Gini distribution score sits at 0.9891, which is about as concentrated as it gets. On the retail side, over 1,873 small holders, tagged as shrimp, together own less than 1% of the supply.
This kind of concentration means price can move sharply on relatively small wallet activity from the top holders, so it's worth factoring in as extra risk alongside the technical setup.
Siren Price Outlook On the 1-hour timeframe
Now let's get into the Siren 1-hour Trading chart, because this is where it gets interesting.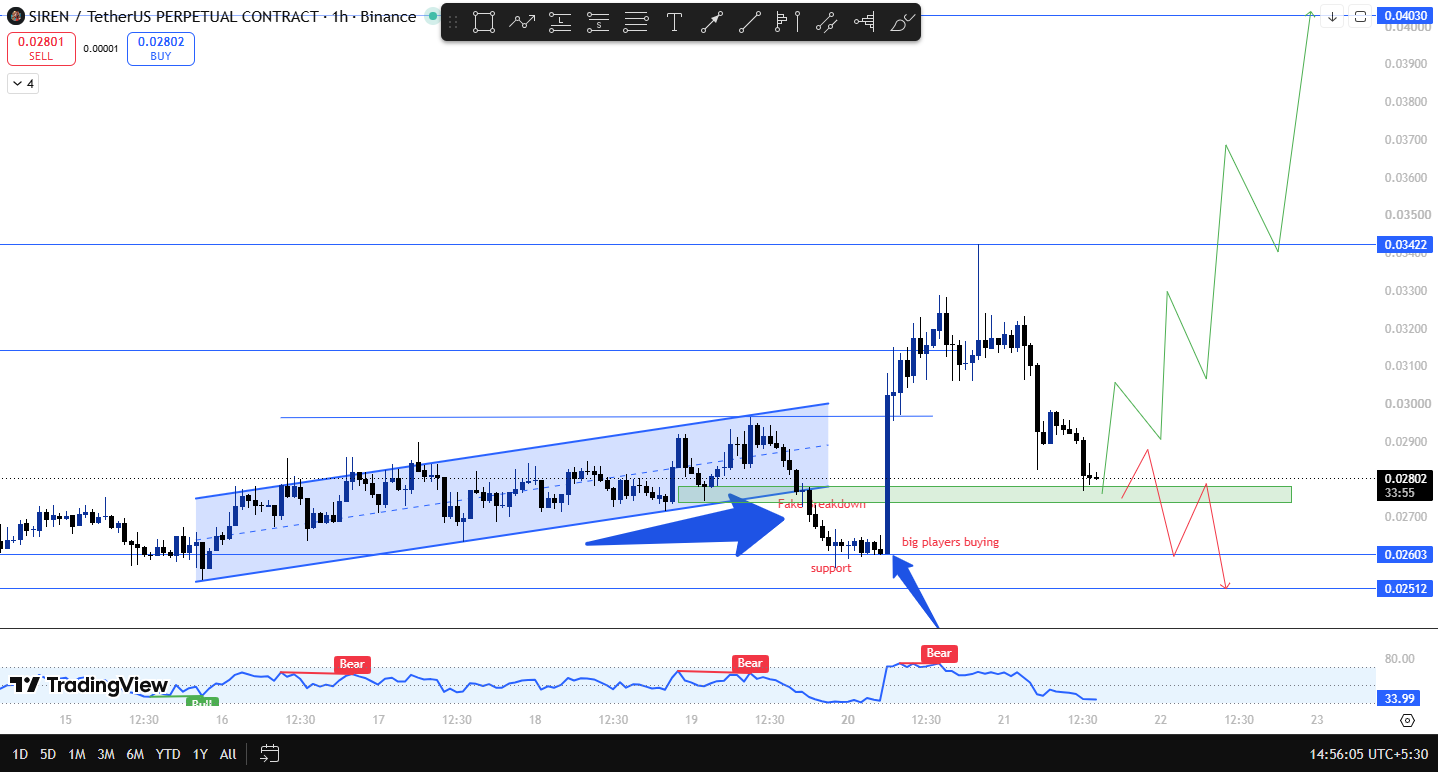
Going back a few days, it was climbing steadily inside a clean rising channel, making higher highs and higher lows in an orderly way.
That kind of structure usually means buyers are in control and just taking their time.
Then the price started slipping out of that channel and dropped below it, and at first glance it looked like a clean breakdown, the kind that usually scares people into selling.
But thisturned out to be a fake breakdown. Price dipped just below the channel, tagged a support zone, and instead of continuing to fall, it got picked straight back up.
Right after that fake breakdown, there's asharp vertical candle on the chart with a big volume push, and this move suggests aggressive buying entered the market.
Price shot up fast from around the $0.026 zone all the way up toward $0.03422, which lines up with a strong resistance level above.
Once it reached that resistance, sellers stepped back in, and the price got rejected hard, pulling all the way back down to where it's trading now, right around the $0.028 zone.
This current zone is acting as support, and it's essentially the same area wherethe big buying wick started from earlier.
From here, there are two ways this can play out. If it holds this support and buyers step in again the way they did before, the setup favors another leg up, first retesting resistance near $0.03422, and if that breaks, a bigger move toward the $0.03422 to $0.04030 zone becomes realistic.
But if this support fails and the price closes below it, thenext levels to watch on the downside are $0.02603 and, below that, $0.02512.
Siren Support And Resistance Levels To Track
Type
Level
Resistance 1
$0.03422
Current Price
$0.02802
Support 1
$0.02603
Support 2
$0.02512
Siren Risk Reward Setup For This Trade
Case
Trigger
Target
Bull Case
Support around $0.02603 holds and buyers return
Move toward $0.03422, extending to $0.03422 - $0.04020
Bear Case
Confirmed close below $0.02603
Slide toward $0.02512
Invalidation Level
This setup stays valid as long as Siren holds above the current support zone near $0.02603. If price closes below that level, the bullish case here breaks down, and $0.02512 becomes the next level to watch on the way down.
Expert View On Siren Price Outlook
What stands out most on this chart is how the fake breakdown played out. Price dipped just enough to shake out nervous sellers before getting bought right back up, and that kind of move oftenpoints to bigger players accumulating rather than random retail activity.
The strong rejection at $0.03422 shows resistance is still very real, though, so this isn't a straight line up.
Combined with how concentrated the holder base is, where just a handful of wallets control most of the supply, this remains a setup that needs the current support to hold before treating the bullish case as confirmed.
Disclaimer
This article is for informational purposes only and should not be considered financial advice. Cryptocurrency markets are highly volatile, and price predictions are not guaranteed. Please do your own research before making any investment decisions.