Seeker Just Broke Its Cage. Now What? Something rare happened in the Seeker market this week, and it did not happen quietly. A token that had been grinding lower for months suddenly ripped th
Seeker Just Broke Its Cage. Now What?
Something rare happened in the Seeker market this week, and it did not happen quietly. A token that had been grinding lower for months suddenly ripped through a wall traders had stopped believing in. No numbers yet, no charts. Just a simple question. Was this the start of something bigger or a trap dressed up as a breakout?
$SKR Price Prediction: Reading the Move Nobody Saw Coming
The SKR price prediction conversation changed overnight, and it changed fast. Traders who had written this token off suddenly had it back on their screens. Here's the thing: sharp reversals like this rarely come from nowhere. There's usually a story behind them, and Seeker's story has been building for weeks, something covered in more depth in thisSeeker Upbit listing surge breakdown from earlier this year.
But ignoring it now is harder. And a chart that spent months trapped inside a falling channel does not escape by accident. Something shifted in demand. We noticed it the moment the daily candle stretched far past its usual range.
So where does that leave anyone watching this token today? Is this rally built on real conviction or just a short squeeze that fades by Friday?
SKR Price Prediction: Where Seeker Stands Right Now
As of 20:02 UTC on August 31, 2026, SKR is trading near $0.0332, up roughly 180% over the past 24 hours, according to CoinMarketCap data showing Seeker priced at $0.03319, up 180.21% in the past day. Market cap sits close to $161M, while 24-hour trading volume runs near $263.49M, putting the volume-to-market-cap ratio above 158%.
That volume figure matters. The circulating supply stands at 4.86 billion SKR out of a 10.55 billion total supply, and the holder count has grown to around 42,000 wallets. Fully diluted valuation runs near $350M, roughly double the current market cap. That gap is worth remembering later.
Why Is Seeker's Price Moving Today
Two things lined up. First, Solana Mobile closed out its Seeker Summer rewards season, and the numbers were not small. The team confirmed over 100 million SKR earned across 16 participating apps, with more than 300,000 badges claimed over four reward rounds, a wrap-up shared directly on theSolana Mobile Seeker Summer announcement.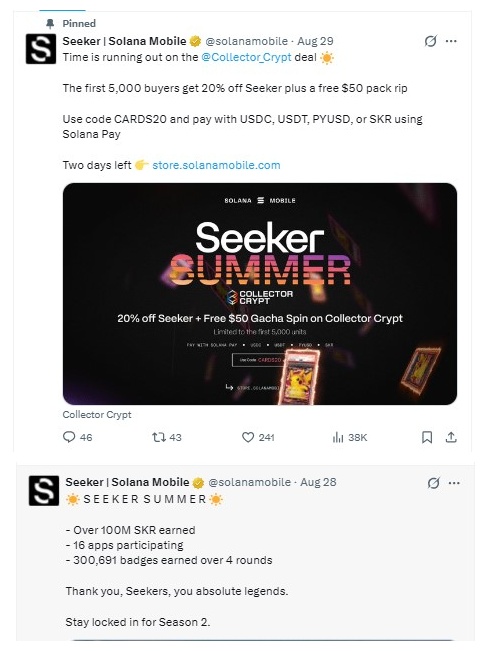
Second, and running in parallel, a time-limited retail push. Solana Mobile promoted a Collector Crypt deal, giving the first 5,000 buyers 20% off Seeker plus a free $50 pack, payable in USDC, USDT, PYUSD, or SKR through Solana Pay.
Turns out, timing both events near month-end created a demand spike right as the chart was already coiled tight. Coincidence? Maybe. Markets don't always care, and the broader pattern of presale and airdrop hype fueling short-term spikes show up across the market, not just here, as this piece onairdrop tokenomics presale mechanics lays out.
SKR Daily Chart Analysis: Breakout, Momentum and Key Levels
The daily chart shows $SKR breaking clean out of a descending channel that had capped price action since February. 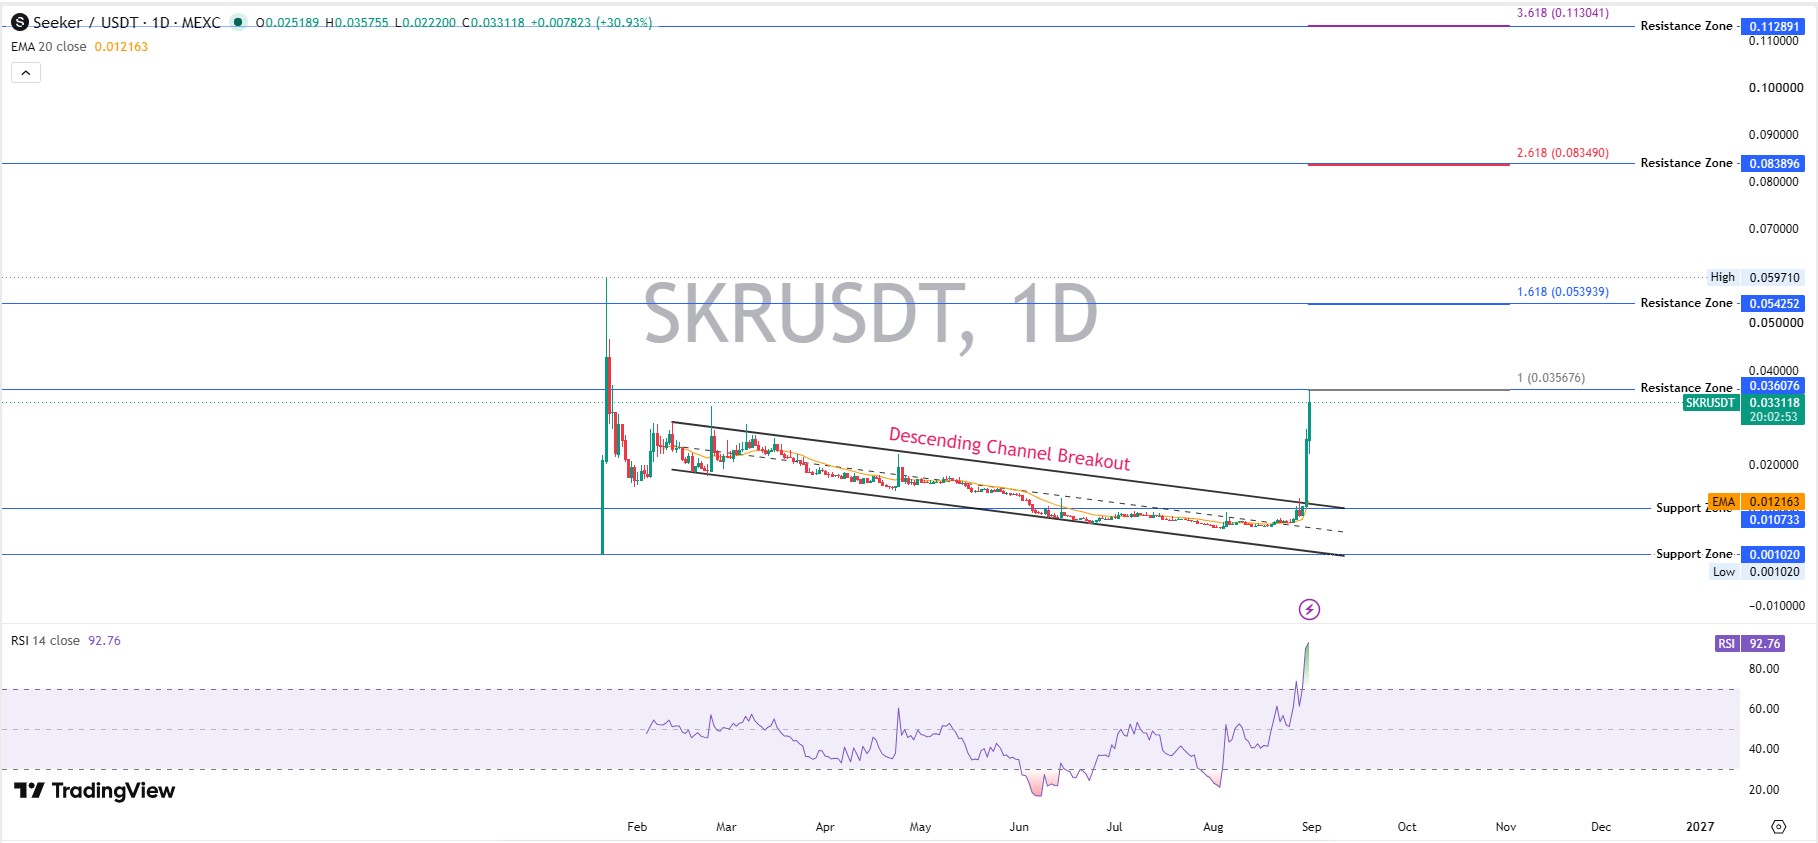
The relative strength index sits at 92.76 on the daily timeframe. That is deep, overbought territory. It does not mean a drop is guaranteed, but it does mean the move is stretched, and stretched moves often pause before they run further.
Immediate resistance sits near $0.0361, a Fibonacci extension zone. Above that, $0.0543; then $0.0839; and $0.1129 further out, based on the chart's extension mapping visible on the SKR/USDT one-day chart on TradingView, where the price recently traded at $0.033118 with the 20-period EMA sitting at $0.012163. Support now rests near $0.0107, close to where the old channel ceiling used to sit. A full breakdown of the setup is available in thisbreakout bull bear case analysis.
SKR Tokenomics and Supply
Supply structure explains part of the volatility. $SKR distribution splits into airdrops at 30%, growth and partnerships at 25%, the Solana mobile team at 15%, Solana Labs at 10%, liquidity and launch at 10%, and the community treasury at 10%.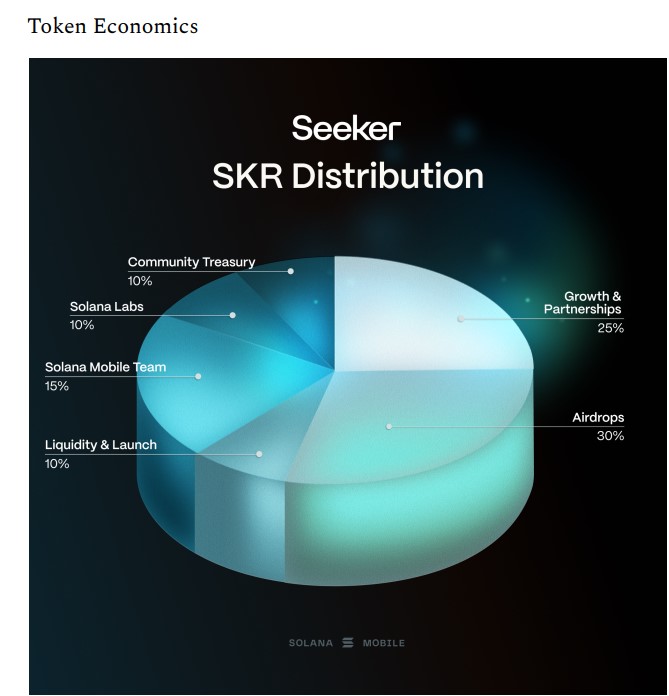
Team and lab allocations carry a 12-month cliff with a 36-month linear unlock after that. Growth and Partnerships tokens are released gradually over 18 months. That means new supply keeps entering the market well past this rally, whatever happens next. Anyone comparing unlock structures against other recentcrypto airdrop schedules will notice Seeker front-loaded its airdrop allocation rather than staggering it.
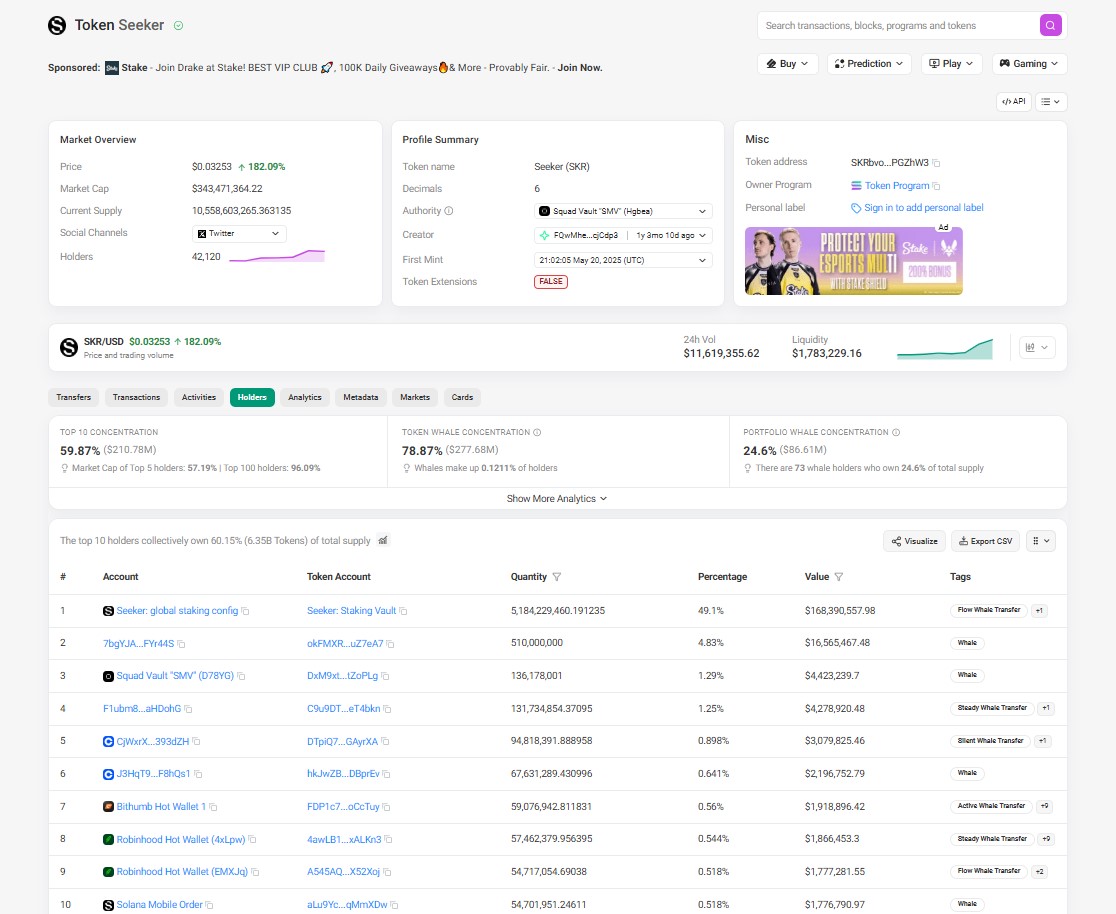
Holder concentration adds another layer. On-chain data shows the top 10 wallets holding roughly 60% of total supply, worth over $210M, with whale wallets making up just over 0.12% of holders. That's thin distribution for a token this size.
Is SKR a Solana Altcoin Worth Watching Long Term
SKR is not a memecoin chasing a joke or a mascot, unlike a lot of the tokens filling upmemecoin market coverage lately. It's tied to Solana Mobile's actual hardware and app ecosystem, which puts it in a different bucket among altcoin price prediction discussions.
Utility-linked tokens tend to hold attention longer than pure hype plays, though that's not a guarantee of price performance. Readers following other emerging tokens in this category can compare setups through the site'sprice prediction hub.
Supply unlocks, exchange listings, and broader market sentiment across Solana-based tokens all weigh on where $SKR heads from here. Anyone watching for new trading venues can browse ongoingexchange listing updates for context on fresh liquidity events.
SKR Price Prediction: Bear, Base, and Bull Scenarios
Timeframe
Bear Case
Base Case
Bull Case
Probability
Invalidation
7 Days
$0.021
$0.030
$0.043
Bear 30% / Base 45% / Bull 25%
Loss of $0.0107 support
30 Days
$0.016
$0.038
$0.058
Bear 30% / Base 40% / Bull 30%
Daily trade below $0.021
Early 2027
$0.012
$0.055
$0.095
Bear 25% / Base 40% / Bull 35%
Breakdown under $0.0161
Fine. Numbers won't hold if sentiment flips, but this frames the range worth watching for any near-term $SKR price target.
What Could Invalidate This SKR Price Prediction
Breaking news reads simple here. Price fails at $0.0361. Volume dries up. RSI cools fast. Sellers step back in. That sequence would flip the current bullish momentum into a bearish trend quickly, and it's happened before on this exact chart.
Bigger risks sit outside the chart too. Continued token unlocks from Growth and Partnerships add supply pressure every month. Derivatives positioning is also worth watching through CoinGlass'sfunding data, since crowded long positions after a 180% spike often unwind hard.
Regulatory headlines can shift sentiment fast as well. Coverage of theregulatory clarity act developments making their way through the Senate this year shows how quickly policy news can override chart setups. And broader macro shocks matter too, the kind tracked in ongoingcrypto market news coverage, since risk-off days tend to hit high-beta tokens like SKR hardest.
Disclaimer
This article is for informational purposes only and does not constitute financial, investment, or trading advice. Cryptocurrency markets, including SKR, are highly volatile, and any price prediction discussed here is speculative. Always do independent research and consult a licensed financial advisor before making investment decisions.