Key Takeaways SoFi Technologies (SOFI) stock has declined 37% year-to-date despite Q1 2026 net income surging 134% compared to last year The fintech company reports Q2 2026 results on July 29
Key Takeaways
- SoFi Technologies (SOFI) stock has declined 37% year-to-date despite Q1 2026 net income surging 134% compared to last year
- The fintech company reports Q2 2026 results on July 29; consensus estimates call for $0.11 EPS and approximately $1.11 billion in revenue
- The options market is anticipating a volatile reaction, with implied movement exceeding 10% following the earnings announcement
- Truist’s Matthew Coad maintains a Hold rating with an $18 target, citing worries about loan platform momentum and competitive headwinds
- Analyst consensus remains at Hold, though the average target of $21.20 suggests roughly 29% potential upside from present levels
SoFi Technologies (SOFI) is set to release its second-quarter 2026 financial results on July 29, with shares currently changing hands at $16.46 — reflecting a steep 37% decline since the start of the year and approximately 50% below the company’s 2026 peak.
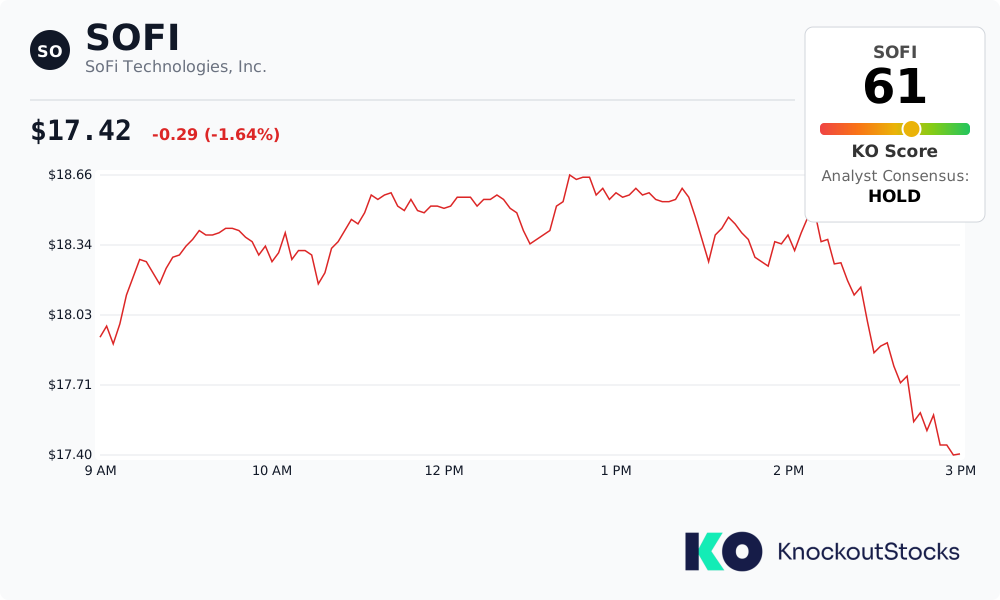 SoFi Technologies, Inc., SOFI
The disconnect between share performance and operational results remains substantial.
First-quarter 2026 results featured all-time high loan originations totaling $12.18 billion, marking a 68% year-over-year increase. The company posted GAAP net income of $166.73 million, representing a 134% surge compared to the prior-year period. Operating income climbed more than 150%.
The member base expanded 35% year-over-year, while 43% of newly acquired products went to current customers — evidence that the company’s cross-selling strategy is gaining traction.
Management’s full-year outlook calls for adjusted net revenue of $4.655 billion, representing approximately 30% growth, alongside adjusted EPS of $0.60. Longer-term projections indicate a 38% to 42% compound annual growth rate in adjusted EPS through 2028.
Metrics Suggest Undervaluation
Trading at a forward price-to-earnings ratio of 28 with a PEG ratio of 0.81, SOFI’s current valuation appears compelling given its expansion trajectory. PEG ratios under 1.0 typically indicate undervaluation relative to earnings growth potential.
Street consensus targets range from $20.58 to $21.20 across various platforms — each suggesting substantial appreciation opportunity from today’s levels. The company has surpassed analyst expectations for seven straight quarters.
By way of comparison, LendingClub commands a forward P/E of 12 while posting just 12.5% year-over-year revenue growth. Upstart holds a forward P/E of 36 alongside a 4.21% profit margin and 0.9% operating margin. Neither competitor possesses a banking charter or deposit franchise.
SoFi’s 14.8% profit margin and 18.3% operating margin demonstrate superior profitability versus both competitors.
Street Sentiment Remains Measured
The prevailing Wall Street view entering the earnings release is Hold — with nine Hold ratings, six Buy recommendations, and three Sell calls.
Matthew Coad from Truist maintained his Hold stance prior to the Q2 report while lifting his price target to $18 from $17. He characterized his near-term outlook as “tactically more bearish” heading into the announcement.
Coad’s reservations encompass net interest margin compression, escalating customer acquisition expenses stemming from neobank rivalry, and possible deceleration in the Loan Platform Business given challenging year-over-year comparisons.
He additionally noted that achieving full-year guidance requires significant acceleration in the second half. Any revenue miss or spending increase could jeopardize the $0.60 EPS projection.
The options market tells a different story. The implied volatility for SOFI surrounding earnings stands at 10.45%, exceeding the stock’s typical post-earnings movement of approximately 8.5% over the previous four quarters.
Consensus estimates for Q2 call for EPS of $0.11, representing 37.5% year-over-year growth, on revenue of roughly $1.11 billion, approximately 30% higher than last year.
SoFi Technologies will announce Q2 2026 earnings before the opening bell on July 29.
The post SoFi Technologies (SOFI) Stock: Q2 Earnings Preview and What Analysts Are Watching appeared first on Blockonomi.