SOL trades below its nine-day EMA as a descending channel keeps sellers in control and puts the $100 support level at risk. Large positions remain 87% long, while roughly $53 million in poten
- SOL trades below its nine-day EMA as a descending channel keeps sellers in control and puts the $100 support level at risk.
- Large positions remain 87% long, while roughly $53 million in potential long liquidations sit below spot across the displayed price range.
- RSI at 36.36 reflects weak momentum, while a recovery above $105 could challenge the descending channel and improve market structure.
SOL technical analysis indicates that the bull market is coming under pressure near the support, which is the time when leveraged bull market positions are at risk.
SOL Holds Below Descending Channel Resistance
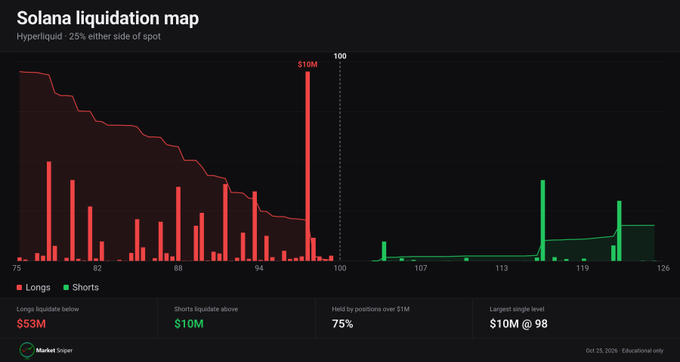
Market Sniper Pro reports that positions exceeding $1 million are 87% long. Smaller positions are also tilted bullish, with 63% positioned long. This split shows that larger accounts carry a stronger bullish bias despite recent price weakness.
Source:
X
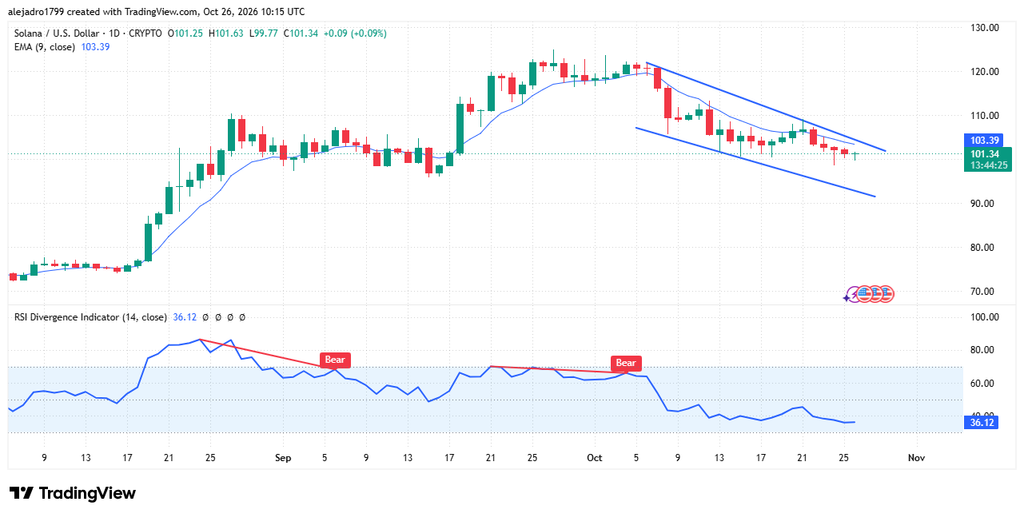
The daily chart places SOL at $101.42 on October 26, below its nine-day EMA at $103.41. The gap leaves the token struggling to regain short-term momentum. Price has retreated from September's peak near $122, forming successive lower highs and lower lows.
Two descending blue trendlines frame the decline since early October. The top line is limited rebounds and the bottom line is a possible path for additional losses. A break above the channel would break this trend but buyers have not yet found the break.
The $100 mark now sits close to the current trading range. A daily close below it could bring $95 into view, followed by the 90–92 area. Those levels remain chart-based reference points, not assured destinations.
Liquidation Map Puts $98 in Focus
Market Sniper Pro identifies a $10 million liquidation level near $98.07 for positions exceeding $1 million. The post places that level 2.3% below spot. Its proximity makes it a key area to watch if selling continues.
The liquidation map estimates $53 million in potential long liquidations below spot. By comparison, potential short liquidations above spot total approximately $10 million. This difference leaves more displayed liquidation exposure beneath the market than above it.

SOL levels approaching 98 may create an additional downward force on forcedclosures.Lowerlevelscontainfurtherliquidationclustersaroundthemid-90s and upper-$80s. They do not necessarily mean that there will be a cascade as it will depend on the liquidity of the market and the management of positions.
If the buyers regain control, then the smaller upside pool is also important. Green bars mark potential short liquidations, including clusters above 100andaroundtheupper-110s. A sustained rally could force some bearish traders to close positions, adding buying demand.
RSI Shows Sellers Retain the Advantage
The daily RSI is 36.36, which is below the 50 neutral value. It is not in the frequently mentioned oversold zone below 30. The reading suggests that momentum is weak but it doesn't confirm how much SOL will drop.
Source:
Tradingview
The RSI divergence indications were bearish in early September and early October. Both had been followed by declines in upward momentum. The next leg down corresponds to the ongoing bearish chart pattern, but divergence is not a confirmation of the next move.
SOL must first get back $103.41 in order to turn things around. A move through 105–108 would offer a stronger test of buying demand. Clearing the channel's upper boundary would provide firmer evidence that the decline is losing force.
The downside is that a daily close below $100 would leave the recent support level in shatters. Traders might then have seen how price reacts around $95 and the bottom line of the channel. The answer at those levels would be a sign of whether sellers would maintain control.
Not much momentum and too many bulls in the long position makes for a vulnerable group. But liquidation estimates are not guarantees of sale and the chart does not foretell the future action. The daily structure is still bearish until SOL regains nearby support or resistance.