Key Highlights SOL is trading at $90.07, down 5.28% in 24 hours, as price touches the 200-Day Moving Average on the daily chart RSI has entered oversold territory simultaneously — a dual-sign
Key Highlights
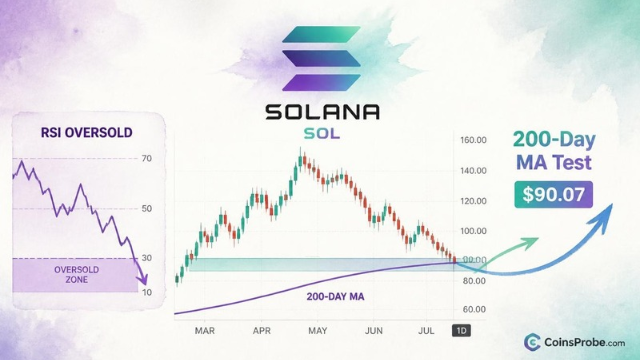
SOL is trading at $90.07, down 5.28% in 24 hours, as price touches the 200-Day Moving Average on the daily chart
RSI has entered oversold territory simultaneously — a dual-signal confluence flagged by an analyst who called this setup on Oct 7, 2026
Solana's ecosystem shows $5.32B TVL and $71.34M in 7-day fees per DeFiLlama — no fundamental deterioration behind the -22.79% correction
SOL spot ETFs recorded 5 consecutive outflow days totaling $11.9M — institutional redemptions a contributing factor to the decline
Solana is trading at $90.07, down 5.28% in the past 24 hours and sitting on one of the most closely watched technical levels in its current structure: the 200-Day Moving Average. When the daily RSI simultaneously enters oversold territory at the same level, it creates the kind of confluence that has historically separated recoverable dips from genuine trend breaks.
An analyst flagged both conditions simultaneously on the 1D chart, noting that SOL has hit the 200-Day MA with RSI now in oversold territory — a setup he previously highlighted on October 7, 2026 as “the dip you want to buy.” The two signals arriving together on the daily timeframe are not coincidental — they reflect simultaneous price exhaustion and momentum depletion at a structurally significant level.
The 200-Day Moving Average is not an oscillator and carries no directional bias — it is a smoothed representation of the average closing price across the prior 200 sessions. What makes it significant is institutional and algorithmic recognition: it is the most widely tracked trend-health benchmark across equities, commodities, and crypto. When price touches it after an extended decline, it represents a potential equilibrium test between buyers who define long-term trend as intact and sellers who believe trend has broken.
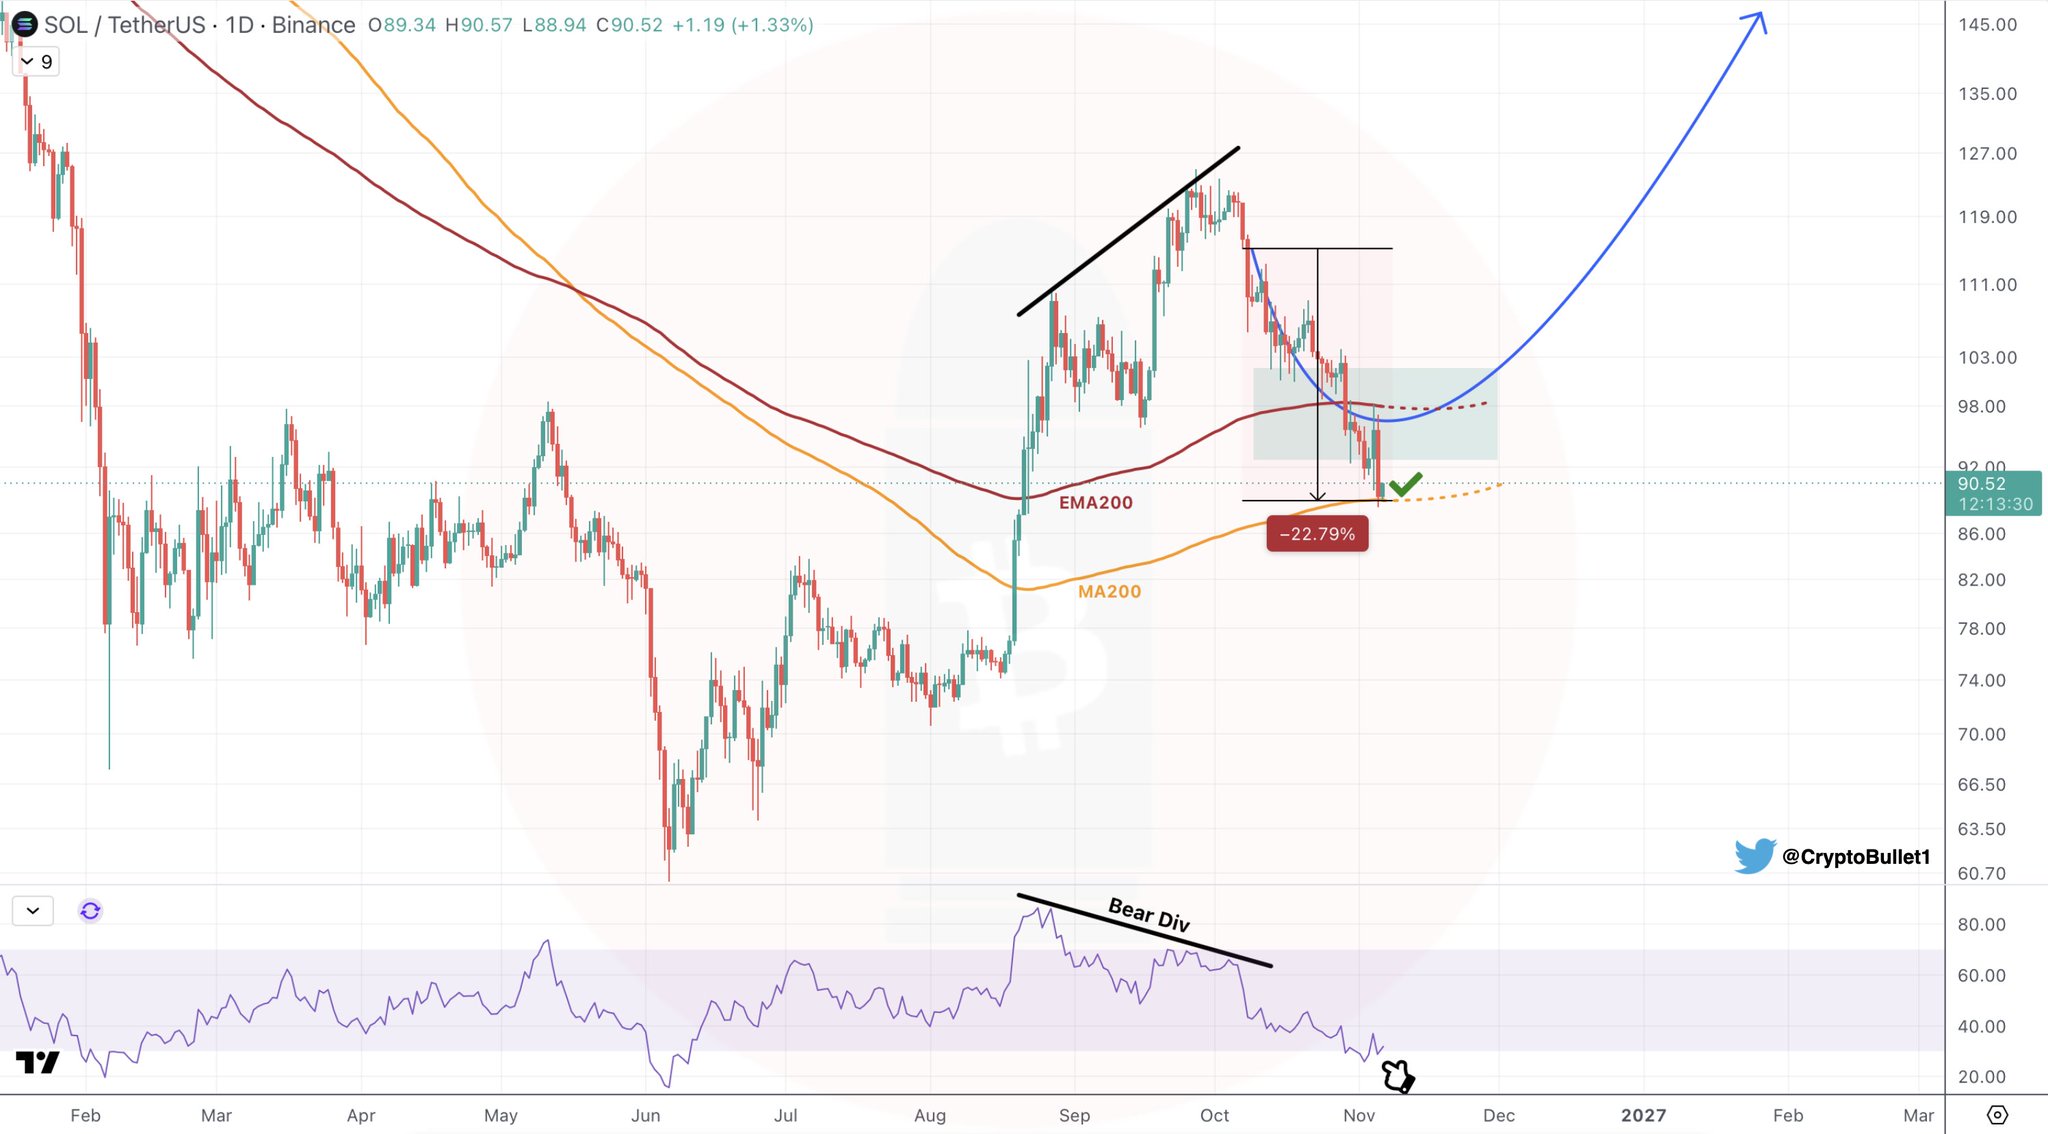
The 1D chart shows SOL’s current price at $90.07 sitting directly at the EMA200, with price also confirmed above the MA200 — meaning the two moving average variants are fractionally separated with price at the upper (EMA200) boundary. The chart also shows a shaded support rectangle near the current price level, indicating a demand zone coinciding with this moving average test. A -22.79% annotation on the chart captures the magnitude of the decline from the recent high into this support zone — a correction steep enough to trigger oversold conditions on the momentum oscillator.
SOL/USDT Chart Analysis | Source: @CryptoBullet1 (X)
Critically, this is not the first time SOL has tested this configuration. The asset has previously used 200-Day MA touches as staging areas for recovery moves. For context on the broader recovery potential, prior analysis noted that SOL’s cup-and-handle structure was projecting a bounce toward $145 — a target that only remains viable if the current support holds.
The Relative Strength Index measures the speed and magnitude of recent price changes on a 0–100 scale. Readings below 30 are classified as oversold — not a prediction that price will rise, but a quantitative statement that selling pressure has become statistically extreme relative to recent history. The chart’s RSI panel shows a “Bear Div” label printed on the chart, indicating that prior to the current decline, RSI was making lower highs while price made higher highs — a bearish divergence that the chart correctly anticipated the pullback that followed.
Now, with RSI having entered oversold territory during the decline, the divergence has resolved. The current oversold reading means the momentum that drove the -22.79% correction has reached an intensity that has historically preceded at minimum a relief bounce. Combined with the 200-Day MA test, the two signals address different dimensions of the same setup: the MA addresses where price is structurally, and the RSI addresses how hard it has been sold to get there.
The technical setup is occurring against a measurable fundamental backdrop. DeFiLlama data shows Solana’s ecosystem carrying $5.32B in total value locked, with $2.20B in 24-hour DEX volume and $9.64M in 24-hour fees generated. Weekly fees across the seven-day window reached $71.34M — a figure that reflects continued network utilization even during the price correction. These are not metrics consistent with a chain in fundamental distress.
The ETF picture is less supportive in the near term. Data via SoSoValue shows SOL spot ETFs recorded a daily net outflow of $1.2M on November 5, 2026, with five consecutive outflow days totaling $11.9M over the prior week. Total ETF net assets stand at $1.33B against $1.47B in cumulative net inflows since launch — meaning the product is marginally underwater relative to aggregate inflows, which explains some of the near-term selling pressure. This ETF outflow context is worth holding alongside the technical signals: the dip is real, and institutional redemption pressure has been a contributing factor.
The macro calendar adds another variable. Nonfarm Payrolls were due November 6 — the same day this analysis was published — with CPI following on November 10 and PPI on November 13. Risk assets including crypto have historically responded to labor and inflation data prints, and a hotter-than-expected jobs number could extend selling pressure before any technical bounce materializes. The RSI and 200-Day MA signals flag exhaustion of the existing move — they do not insulate SOL from new macro-driven downside if macro data surprises to the upside.
It is also worth noting the broader context around Solana’s ecosystem sell pressure. Prior reporting tracked Pump.fun’s sustained SOL sales to Kraken totaling $875.5M — a persistent supply-side pressure that has been a structural feature of Solana’s market, separate from broader sentiment.
The 200-Day MA and RSI oversold reading are non-directional in isolation. Together, they construct a specific conditional picture: price has declined -22.79% into a historically recognized support structure while momentum has reached statistical exhaustion. This configuration has preceded recoveries. It has also preceded continuations lower when macro conditions or project-specific catalysts overrode technical support.
What the signals confirm: the dip has been severe enough to exhaust momentum at a structurally significant moving average. What they do not confirm: that the dip is over. The bear divergence that the RSI panel labeled on the prior high correctly anticipated the decline — the current oversold reading is the resolution of that divergence, not an automatic buy trigger.
What to watch for continuation: a daily close back above the EMA200 with RSI recovering above 30 would be the minimum technical confirmation that the support has held. Without that close, the current price position remains a test, not a confirmed bounce. The prior analysis on this structure had identified a potential for deeper pullback before the next rally — the current 200-Day MA test is precisely the kind of level where that call gets resolved one way or the other.
SOL’s $5.32B TVL, $71.34M in weekly fees, and $2.20B in daily DEX volume establish that the network is functioning. The price at $90.07 is a technical event, not a fundamental collapse. But the ETF outflows, Nonfarm Payrolls timing, and unresolved macro uncertainty mean the two signals flag a setup — they do not guarantee an outcome. Watch the daily close at the EMA200 near $90 as the first confirmation level traders need to see hold.
Disclaimer: The views and analysis presented in this article are for informational purposes only and reflect the author’s perspective, not financial advice. Technical patterns and indicators discussed are subject to market volatility and may or may not yield the anticipated results. Investors are advised to exercise caution, conduct independent research, and make decisions aligned with their individual risk tolerance.
Also Read: NEAR Prints TD Sequential ‘9’ Buy Signal After a 39% Drop