SOL faces a key test near $98.60 after rejection at resistance, with further losses possible if buyers fail to defend support. A break below $98.60 could send SOL toward 76.76–87.77, within a
- SOL faces a key test near $98.60 after rejection at resistance, with further losses possible if buyers fail to defend support.
- A break below $98.60 could send SOL toward 76.76–87.77, within a broader support zone ranging from $70.16 to $94.43.
- Reclaiming $109, the October 21 high, would improve the recovery outlook and make another upward move more likely for SOL.
SOL price action remains under pressure after a sharp rejection near resistance, leaving traders focused on support around $98.60 and resistance at $109.
SOL Tests Support After Resistance Rejection
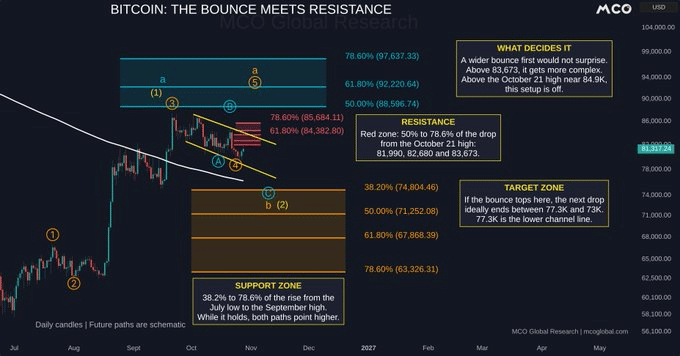
More Crypto Online reports that SOL faced a sharp rejection at resistance but remains above support near $98. The analyst identifies $98.60 as the level that could determine the next move. A decisive break below it would open the way for another decline.
Source:
X
SOL recently traded at $99.56, down 2.38% over 24 hours. Its seven-day loss reached 4.74%, according to the supplied market data.The price is nearing the support level determined through the analysis.
That nearness does not leave much room for the purchaser to turn a blind eye to any additional selling. If the $98.60 level is held, it will allow the market to stabilise. But if weakness persists, the risk of further downside should be raised.
The first question is "can the current area be defended? A recovery would need to develop beyond a brief bounce. Without stronger buying, resistance could continue to limit upward attempts.
Lower Targets Come Into View Below $98.60
More Crypto Online identifies $76.76 to $87.77 as a potential downside target if support breaks. This range sits within the wider support area between $70.16 and $94.43. Such a move would place SOL well below its recent price.
The nearer target range offers the first area to watch during a sustained decline. Reaching it would not automatically produce a rebound. Buyers would need to show demand before a recovery could take shape.
The broader zone extends beneath the current market and covers several price levels. If selling continues through the narrower range, traders may turn their attention toward this wider area. Price behaviour there would help establish whether buyers are willing to return.
A minor drop short of $98.60 would not alone clinch the trend. Traders would have to determine if SOL remains below support or if it soon returns to it. A sustained breakdown would provide stronger evidence that sellers remain in control.
A Move Above $109 Would Shift the Outlook
The October 21 high near $109 marks the key upside threshold in the supplied analysis. More Crypto Online says a move above that level would make another advance more likely. Until then, SOL must recover ground lost during its recent rejection.
The distance from $99.56 to $109 leaves a clear hurdle for buyers. Reaching resistance would be one step, not proof of a breakout. Price would need to move above it and maintain that position.
For now, the market faces two clear possibilities. A break below $98.60 would bring the lower target range into focus. A move above $109 would instead strengthen the case for another upward attempt.
Trading between these levels would leave SOL without a confirmed directional break. Buyers would need to regain resistance, while sellers would look for support to fail. The response at either boundary should offer a clearer reading of market direction.
The latest figures also show that SOL has lost ground over both measured periods. The daily loss is 2.38%, with the weekly loss coming in at 4.74%. Those readings are in a chart formation where support and resistance are still well defined.
Neither outcome is confirmed by the supplied data. For now, $98.60 remains the downside level to watch, while $109 marks the recovery threshold. SOL's next sustained move around these prices will determine which scenario gains support.