TL;DR The Solana three-day SuperTrend indicator has turned bullish for the first time since October, hinting at a potential trend reversal. Around 100 million SOL left exchanges while 1.4 mil
TL;DR
- The Solana three-day SuperTrend indicator has turned bullish for the first time since October, hinting at a potential trend reversal.
- Around 100 million SOL left exchanges while 1.4 million new addresses joined the network, pointing to growing adoption and reduced sell-side pressure.
- Analysts say Solana must secure a three-day close above $85 to clear a major resistance zone and target $100 and $127.
- A drop below $70 would invalidate the bullish setup and could expose SOL to a deeper correction toward $53.
Solana may be showing early signs of a trend reversal after months of weakness, but analysts say the cryptocurrency still faces a crucial technical hurdle before a broader recovery can take shape.
Recent chart analysis suggests momentum is improving, supported by stronger on-chain activity and declining exchange reserves. However, a large historical supply zone between $76 and $85 continues to stand in the way of a sustained rally. If buyers fail to overcome that resistance, the recovery could lose steam despite improving fundamentals.
Bullish Technical Indicators Begin to Align
According to the latest chart analysis shared by crypto analyst Ali Martinez, Solana’s three-day SuperTrend indicator has turned bullish for the first time since October, signaling what could be the beginning of a new market cycle.
The previous bearish signal accurately captured roughly a 74% correction in SOL’s price, making the latest flip noteworthy for technical traders. The accompanying Wyckoff Accumulation chart also suggests Solana may be transitioning from a prolonged accumulation phase toward a potential markup phase, provided buyers maintain control above key support levels.
The Wyckoff structure identifies a completed “spring” and a successful last point of support (LPS), patterns that are often associated with renewed buying interest before a larger move higher. While technical formations are not guarantees of future performance, they are widely monitored by market participants when assessing trend reversals.
Exchange Outflows Point to Lower Selling Pressure on Solana
Technical indicators are being reinforced by improving on-chain data.
Over the past week, approximately 100 million SOL reportedly left exchange reserves, reducing the amount of tokens immediately available for sale. Large exchange outflows are often interpreted as investors transferring assets into self-custody or staking rather than preparing to sell, which can ease short-term selling pressure.
Network activity has also strengthened. During the past three weeks, roughly 1.4 million new addresses joined the Solana network, suggesting continued user growth despite broader market uncertainty. Recent industry data likewise shows expanding activity across the Solana ecosystem, including higher real-world asset adoption and increasing transaction volumes.
These trends suggest that underlying network participation continues to improve even as price remains below previous highs.
Heavy Resistance on Solana Still Blocks the Path Higher
Despite the improving outlook, Solana still faces a significant technical challenge.
The UTXO Realized Price Distribution (URPD) shows that approximately 125 million SOL previously changed hands between $76 and $85. Investors who bought within that range may choose to sell once prices revisit their entry points, creating substantial overhead resistance.
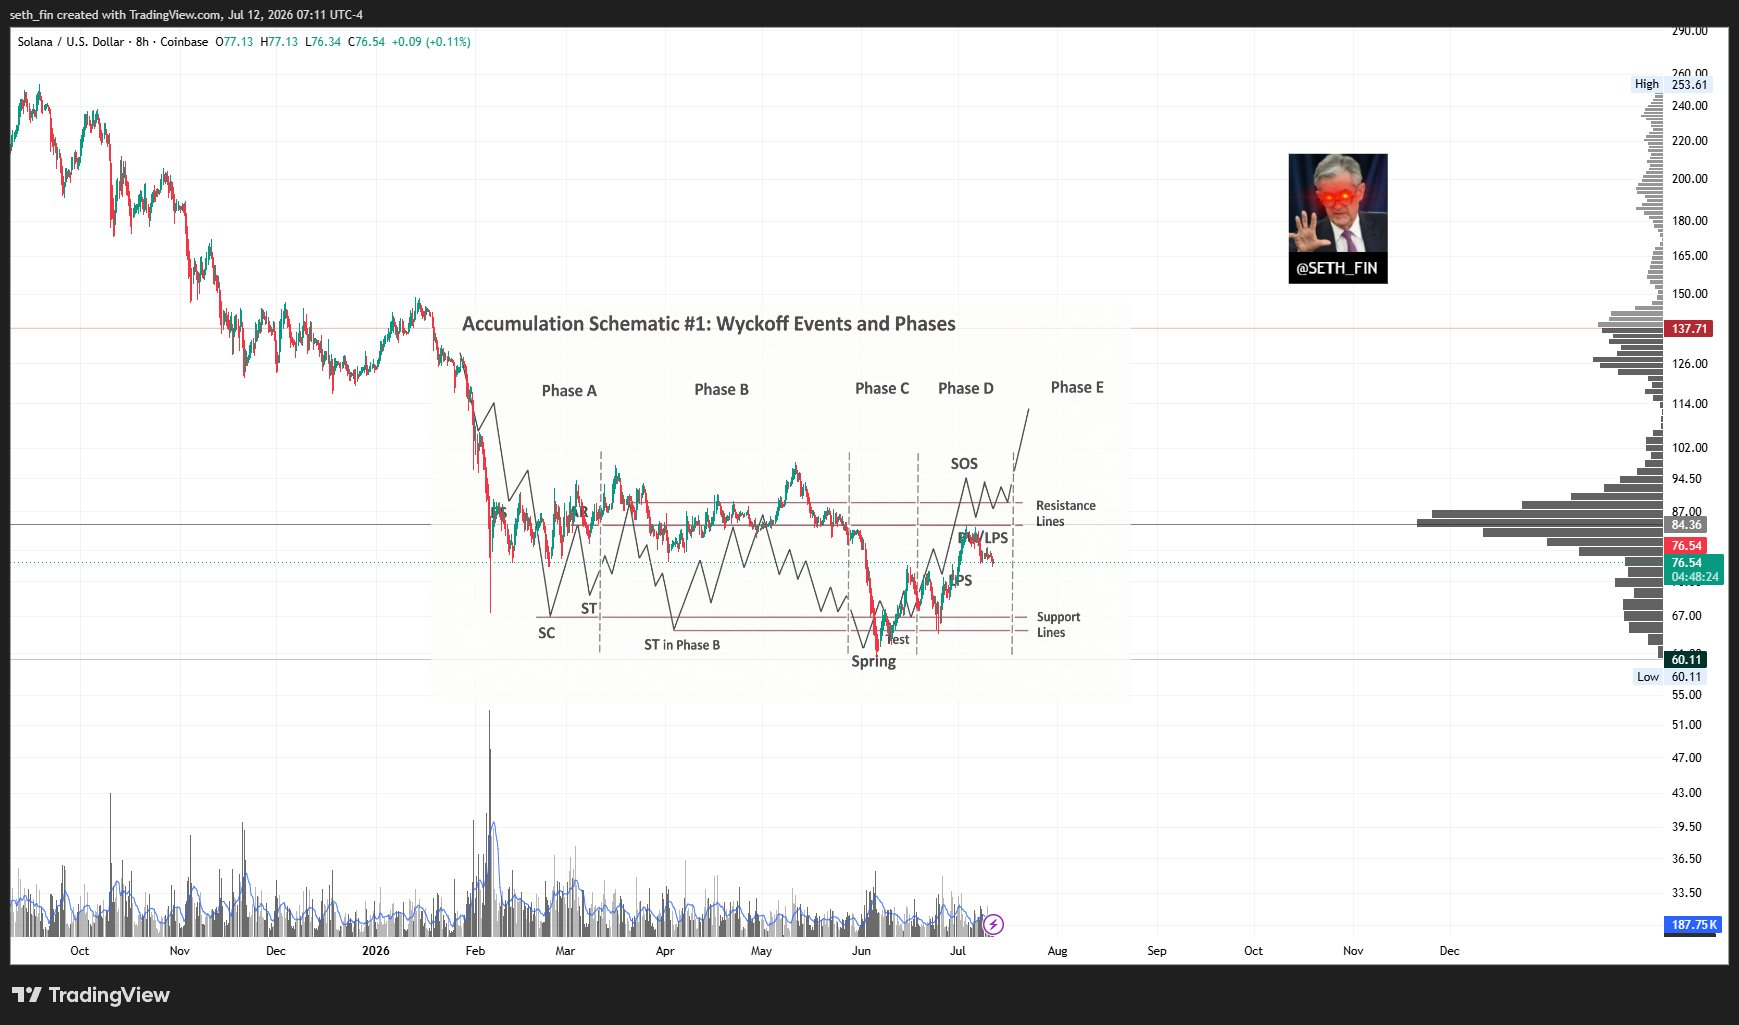
SOL/USD Chart | Source:
XAnalysts believe a convincing three-day close above $85 would clear much of this supply zone and potentially open the way toward higher liquidity targets around $100 and $127. Until that breakout occurs, price action could remain volatile as buyers attempt to absorb selling pressure from holders trapped during previous declines.
While optimism has returned, the bullish outlook depends on Solana maintaining its current support structure.
A decisive break below $70 would invalidate the current bullish setup and cause the SuperTrend indicator to flip bearish once again. Under that scenario, technical analysts see the next major support zone near $53, where historical trading activity suggests stronger buying interest could emerge.
For now, the crypto appears to be at an important crossroads. Improving network metrics, exchange withdrawals, and bullish chart signals are strengthening the recovery narrative, but the market must still overcome one of its largest historical resistance zones before traders can confidently call the start of a broader uptrend.
The post Solana Eyes Breakout as Bullish Signal Returns, but $85 Remains the Level to Beat appeared first on Blockonomi.