Solana News Today: Can the 65% Tokenized Stock Surge Last? If you follow Solana news today, one number stands out. SolanaFloor says the network captured 65% of tokenized stock trading volume
Solana News Today: Can the 65% Tokenized Stock Surge Last?
If you follow Solana news today, one number stands out. SolanaFloor says the network captured 65% of tokenized stock trading volume yesterday, which is 85% higher than the combined share of all other networks.
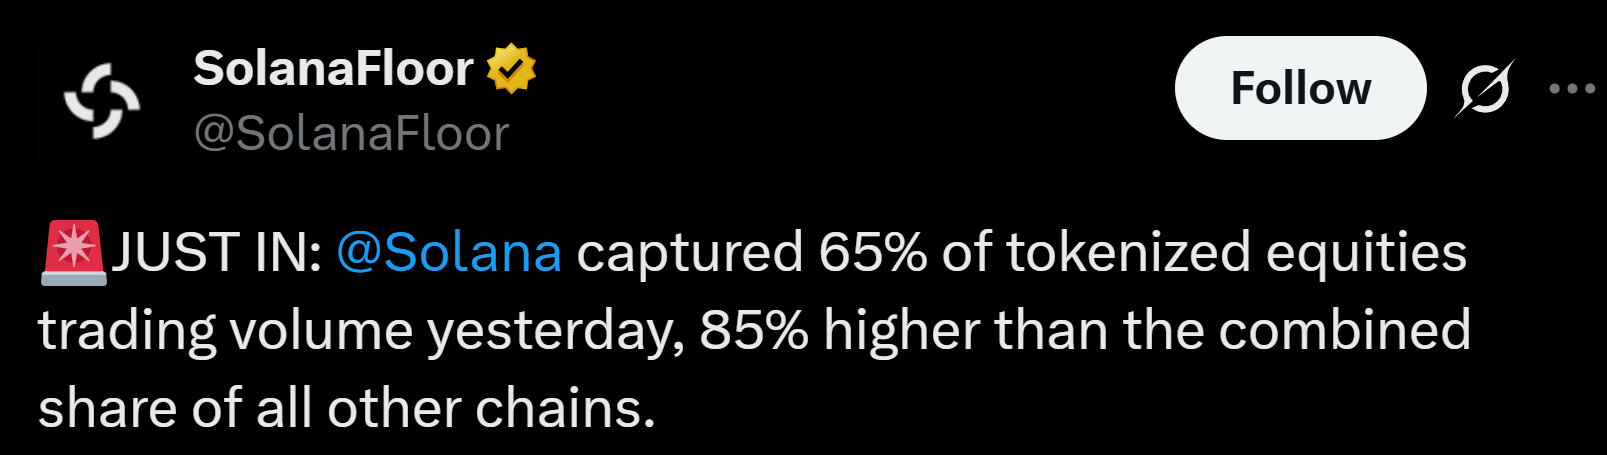
Source: SolanaFloor on X
Tokenized stocks are a fast-growing corner of crypto, and the race to host them is getting tighter.
Below, we explain what the number means, how it has moved since July, what the chart leaves out, and how SOL itself is trading.
What the News Says and What It Means
Imagine a company share, like a stock you can buy through a broker, but copied as a digital token that trades on a crypto network instead of a stock exchange.
That is a tokenized stock. Trading volume is simply the total amount of money traded.
The same post says that on October 10, 2026, the network held 65% of this trading, and theBlockworks chart it shares shows the same split.
In plain words, roughly $65 of every $100 traded went through this network, and $35 went through all the others combined. The math matches the post, because 65 is almost double 35.
Detail
Number
Date
October 10, 2026
This network’s share
65%
All other networks
35%
Data source
Blockworks Solana
How the Share Has Moved Since July
Readers of Solana News today should know this was not a steady climb. The chart shows big swings.
These numbers are read by eye from the chart, so treat them as rough:
Period
Rough share
Mid-July
Above 90%
Late July
Fell to about 20%, then rebounded near 80%
Early August
Around 70%
Late August
Slid below 40%, then under 10%
Early September
Low point near 3%
Mid-September to early October
About 25% to 37%
October 10
65%
The share was around 35% in the days before October 10, so the jump is one of the sharpest one-day moves on the chart.
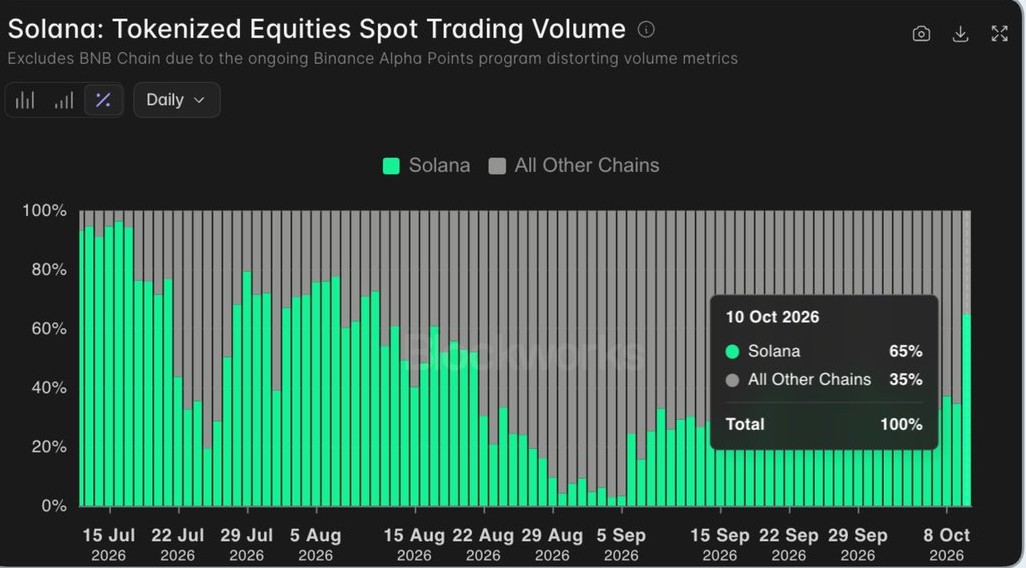
It also brings the share back to a level last seen in August.
The Fine Print Behind the 65%
A big number deserves a careful look. Here is what the chart does and does not say:
One network is left out. The chart’s own note says it excludes BNB Chain, because an ongoing Binance Alpha Points rewards program is distorting its volume numbers. So 65% is the share among the networks counted, not among every network.
It is a share, not a size. A share can rise because this network got busier or because the others slowed down. The chart cannot tell us which.
It is one day. The chart itself shows that high readings can fade within weeks.
No reason is given. No source explains why the share jumped on October 10.
How the SOL Chart Looked
The coin’s own chart is a different story. Here is the snapshot from CoinMarketCap on October 12, 2026:
Metric
Value
Price
$111.57
24-hour change
+2.3%
Market cap
$65.72B
24-hour trading volume
$1.81B (+39.11%)
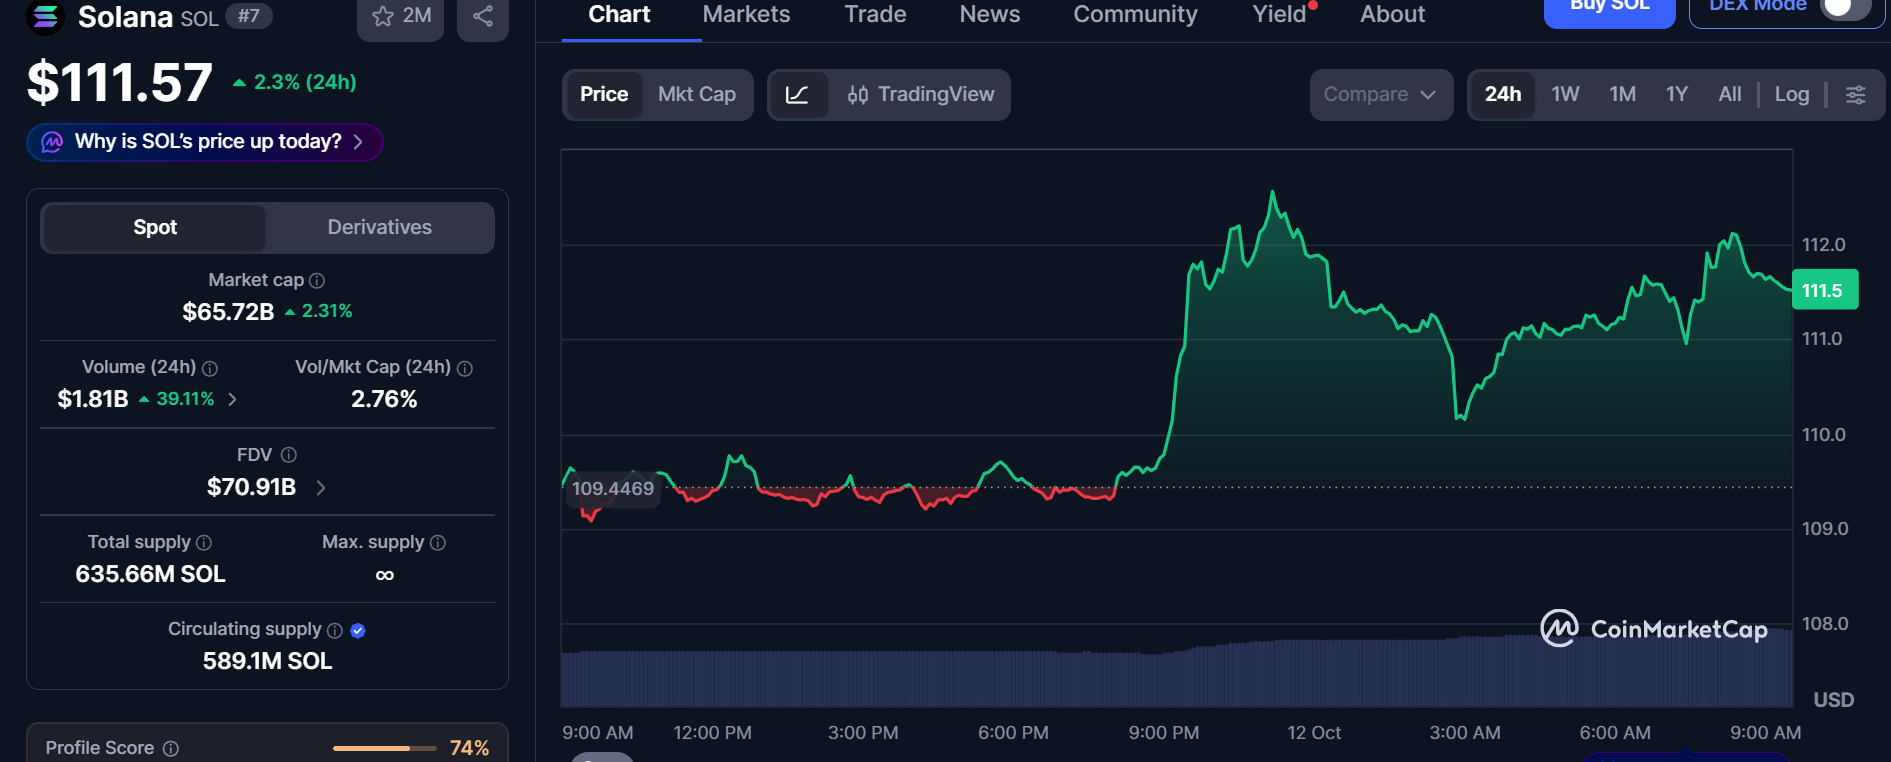
Source: CoinMarketCap live data
The 24-hour chart started near $109.45 and drifted sideways for hours. Late in the evening it jumped above $112, dipped to about $110.20 in the early morning, and recovered to around $112 before settling near $111.50.
That move began after the October 10 reading, and no source links it to the tokenized stock news, so treat any connection as a guess.
Second Spot Solana ETF Coming to Hong Kong
According to the official Solana on X, a second spot Solana ETF is coming to Hong Kong. An ETF is a fund that trades like a stock, so people can follow the coin’s price without buying the coin themselves.
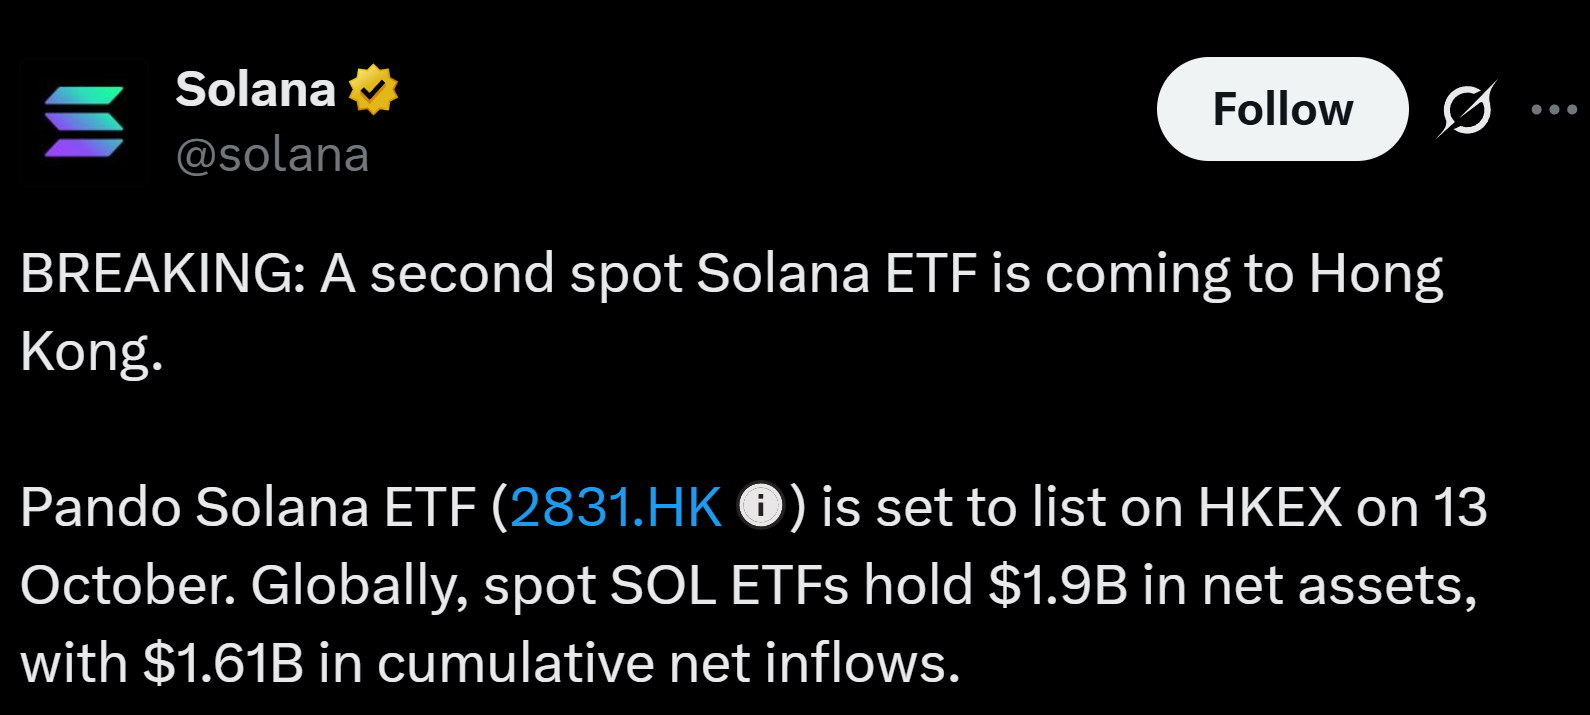
“Spot” means the fund holds the real coin.
Fund: Pando Solana ETF (ticker 2831.HK)
Listing: set to list on the Hong Kong stock exchange (HKEX) on October 13
Global picture: spot SOL ETFs hold $1.9B in net assets, with $1.61B in cumulative net inflows (money that came in minus money that went out)
The listing is scheduled, not yet live, so the date could still change.
What to Watch Next
Anyone following Solana news today should keep an eye on these points:
Whether the share stays above 50% in the next few daily readings.
New updates from SolanaFloor and the Blockworks dashboards.
Whether other networks win back volume, as they did in late August.
Whether trading in SOL stays busy or cools down.
Conclusion
A single day gave this network almost two-thirds of tokenized stock trading, and that is real news worth watching.
Still, the chart leaves out BNB Chain; the share has swung widely since July, and nobody has explained the jump.
Until more days of data arrive, the sensible approach is to follow the numbers, not the excitement. Keep following Solana news today for the next update.
Disclaimer
This article is for educational and informational purposes only and is not financial or investment advice. Crypto assets are high risk, their prices can be very volatile, and you can lose some or all of your money. Always do your own research and consider speaking with a licensed financial advisor before making investment decisions.