Solana is trading close to $74.74 today, up about 2.51% on the day. The token has spent weeks stuck inside a falling price channel. Now it looks like it might be breaking out. At the same tim
Solana is trading close to $74.74 today, up about 2.51% on the day. The token has spent weeks stuck inside a falling price channel. Now it looks like it might be breaking out.
At the same time, spot SOL ETF inflows have slowed down a lot in August. That mix of weak ETF flows and a possible chart breakout is worth watching closely.
What Is Solana's Price Doing Right Now?
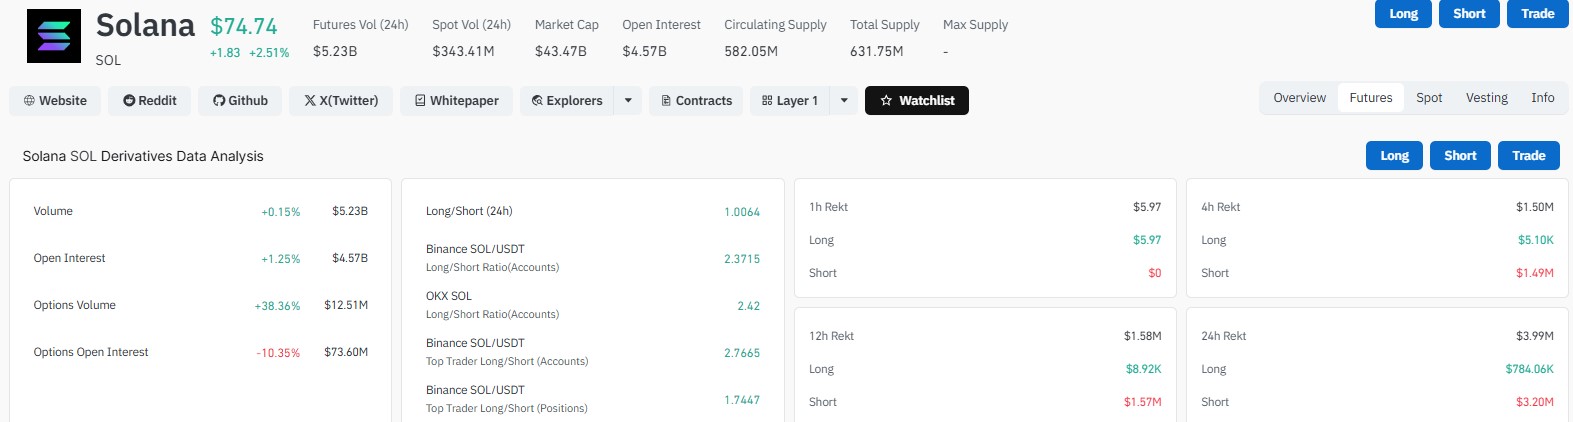
SOL is changing hands around $74.74, according to derivatives data. The daily chart shows a close of $74.75, up 1.47% for the session.
Solana's 24-hour trading volume sits at $5.23 billion. Its market cap is $43.47 billion, with open interest at $4.57 billion. Circulating supply stands at 582.05 million SOL out of a total supply of 631.75 million.
Is Solana Breaking Out of Its Downtrend?
The daily chart tells an interesting story. SOL has been moving inside a descending channel since early July, marked by two white trendlines sloping downward.
Price action is now pushing against the upper line of that channel. That is often a sign that sellers are losing some control.
If the altcoin closes firmly above the $75 to $78 zone, traders may see it as a real breakout, not just a wick. A move like that could open the door to $82 and $88.
A stronger push beyond that range could bring $95 to $96 back into view, levels last seen in early July.
On the flip side, if SOL fails to hold above the channel line, a pullback toward $71 to $72 is possible. That area has acted as support in recent weeks.
Solana Long/Short Ratio and Liquidation Data
Futures data shows traders leaning slightly bullish on Solana right now. The Binance SOL/USDT long/short account ratio sits at 2.3715, while OKX shows a ratio of 2.42.
Looking at Binance's top trader positioning, the long/short ratio by position size is 1.7447. That is lower than the account-based ratio, suggesting bigger traders are a bit more cautious than smaller retail accounts.
Liquidation data over the past 24 hours shows $3.99 million in SOL positions wiped out. Of that, $3.20 million came from short positions, while $784,060 came from longs.
This tells us shorts have been getting squeezed more than longs recently, which lines up with the price grinding higher.
Timeframe
Total Rekt
Long Liquidations
Short Liquidations
1 Hour
$5.97
$5.97
$0
4 Hours
$1.50M
$5.10K
$1.49M
12 Hours
$1.58M
$8.92K
$1.57M
24 Hours
$3.99M
$784.06K
$3.20M
Why Have Solana ETF Inflows Slowed Down in August?
Spot SOL ETFs had a strong run earlier this year, but August has been quiet so far. Daily net inflows have been close to flat for most of the month.
On August 7, total daily net inflow came in at $0.00, with $40.63 million in total value traded. August 6 was worse, showing a net outflow of $859,450.
August 5 also recorded $0.00 in net inflow. August 4 was the one bright spot, with $1.00 million flowing in. August 3 again showed $0.00.
Despite the slowdown, cumulative net inflows into SOL spot ETFs remain strong at roughly $1.15 billion. Total net assets sit around $869.97 million as of August 7.
Date
Daily Net Inflow
Total Value Traded
Total Net Assets
Aug 7, 2026
$0.00
$40.63M
$869.97M
Aug 6, 2026
-$859.45K
$25.89M
$857.24M
Aug 5, 2026
$0.00
$37.62M
$875.26M
Aug 4, 2026
$1.00M
$31.08M
$875.26M
Aug 3, 2026
$0.00
$32.03M
$871.90M
This slowdown does not necessarily mean investors are losing interest in Solana. It may simply reflect a broader summer lull in crypto ETF trading across the board.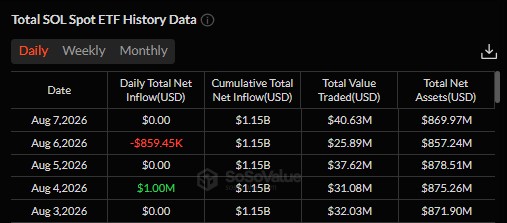
Does Bitcoin's Breakout Matter for Solana's Price?
Bitcoin recently broke above a downtrend line that had held for close to ten months. That is a meaningful technical event for the wider crypto market.
When Bitcoin breaks a long-term downtrend, altcoins like Solana often get a tailwind. Traders tend to rotate risk appetite back into altcoins once Bitcoin shows strength.
This could add some support to Solana's own breakout attempt, though nothing is guaranteed. Crypto markets can reverse quickly, and Solana still needs to prove it can hold above resistance on its own.
Solana Price Prediction: What Could Happen Next?
Solana sits at a technical crossroads. The descending channel breakout is a bullish signal on paper, and short liquidations suggest some momentum shift.
But ETF inflows cooling off in August is a reminder that institutional demand can ebb and flow. Traders watching Solana should keep an eye on the $75 to $78 zone as the key level to watch.
A confirmed close above that range, paired with rising ETF inflows, would strengthen the case for a move toward $82 to $96. A rejection there, combined with more ETF outflows, could send SOL back toward $71.
Disclaimer: This article is for informational purposes only and does not constitute financial, investment, or trading advice. Cryptocurrency markets are highly volatile and unpredictable. Always do your own research before making any investment decisions.