Solana faces renewed selling pressure near $85 as buyers attempt to defend support following repeated failures around the $86 region. The long-term chart shows that there is a zone of accumul
- Solana faces renewed selling pressure near $85 as buyers attempt to defend support following repeated failures around the $86 region.
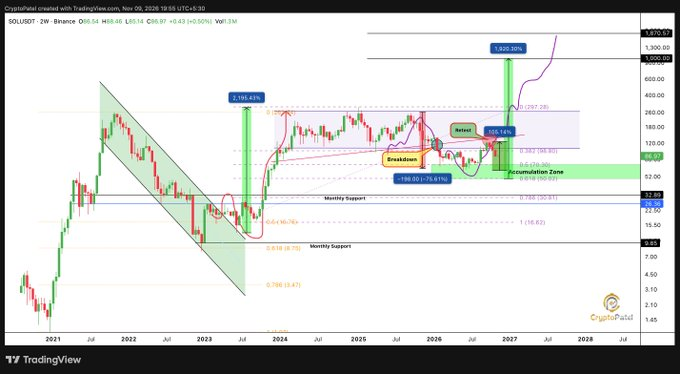
- The long-term chart shows that there is a zone of accumulation, with a monthly support level at $32.89, and a major resistance level at $297.28.
- The broader projection targets 500–1,000, although SOL must regain momentum and overcome several resistance levels before advancing.
Solana price action has exhibited signs of weakness in recent trading, but the larger timeframe chart suggests a period of consolidation and potential recovery targets.
Solana Faces Renewed Selling Pressure Near $85
Crypto Patel's long-term outlook places SOL within another potential accumulation phase. His chart projects possible targets between $500 and $1,000. The market data extended the selling pressure around $85, as of writing.
Source:
X
SOL's closing price was $85.48, a 1.11% decrease from the day before. The token had been trading above $87 before buyers turned back to sellers. The subsequent decline carried prices below $86 and toward immediate support.
The $87 region remains an important resistance level after the failed recovery. Price struggled to maintain its earlier advance above this threshold. Consequently, sellers retained control throughout much of the displayed session.
The $85 level now provides the immediate support reference. Buyers responded near this area, producing a modest rebound. However, the recovery remains limited against the preceding downward movement.
Long-Term Structure Points Toward Accumulation
The broader two-week chart provides another perspective on SOL's position. After the highs of 2021, the token moved into a long bear market channel. That rebound persisted in 2022 with recovery beginning in 2023.
The subsequent recovery period became a long consolidation period. SOL moved between established support and resistance before breaking higher. The chart marks this breakout alongside a later retest.
That retest now forms part of the broader accumulation thesis. The green accumulation zone sits beneath the recent trading structure. It represents an area where buyers could potentially establish another base.
Fibonacci retracement levels also provide reference points for this region. These levels help assess where the previous advance could find support. Monthly support near $32.89 provides another important downside reference.
Recovery Targets Depend on Stronger Buying Momentum
A deeper correction could bring the $32.89 level into consideration. The chart also identifies monthly support around $9.85. These levels become relevant if the accumulation region fails.
The long-term chart identifies approximately $297.28 as an important resistance reference. Reclaiming this region would mark considerable progress from current levels. However, SOL must overcome several intermediate barriers before reaching it.
Beyond this resistance, the broader projection identifies $500 as another target. The top one shoots off towards $1000 and up. These are long-term potential price destinations, not confirmed.
At the same time, market capitalisation is around $50.53 billion. The volume of trades reported for 24 hours is $2.15 billion. This is a 20.57% decrease over the period under observation.
The circulating supply stands at 591.14 million SOL, against 637.31 million total. The displayed holder count also reaches approximately 1.07 billion. These figures provide additional context for the asset's market structure.
For now, $85 remains the immediate level buyers need to defend. A recovery above $86 could improve short-term conditions. Reclaiming $87 would provide a stronger indication of renewed demand.