Key Takeaways Reclaim of the 0.786 level lasted one day Friday’s high stalled just under $74 Rally from June low is 87% erased RSI near 23.5, oversold but not turning The Level SOL Couldn’t K
Key Takeaways
Reclaim of the 0.786 level lasted one day
Friday’s high stalled just under $74
Rally from June low is 87% erased
RSI near 23.5, oversold but not turning
The Level SOL Couldn’t Keep
When SOL traded near $79 a week ago, Coindoo’s November 13 analysis flagged the 0.786 Fibonacci retracement near $74 as the last level above $60. This week’s trading has revolved around that line. SOL broke below it within days, then closed back above it on November 17, near $75, for a single session. It slipped under the level again over the next two days, and Friday’s candle opened just below it, near $73. The high stopped roughly 35 cents short of the level before sellers pushed price to an intraday low near $68. As of 18:49 UTC, with about five hours left in the session, SOL traded near $69, down 6.14%.
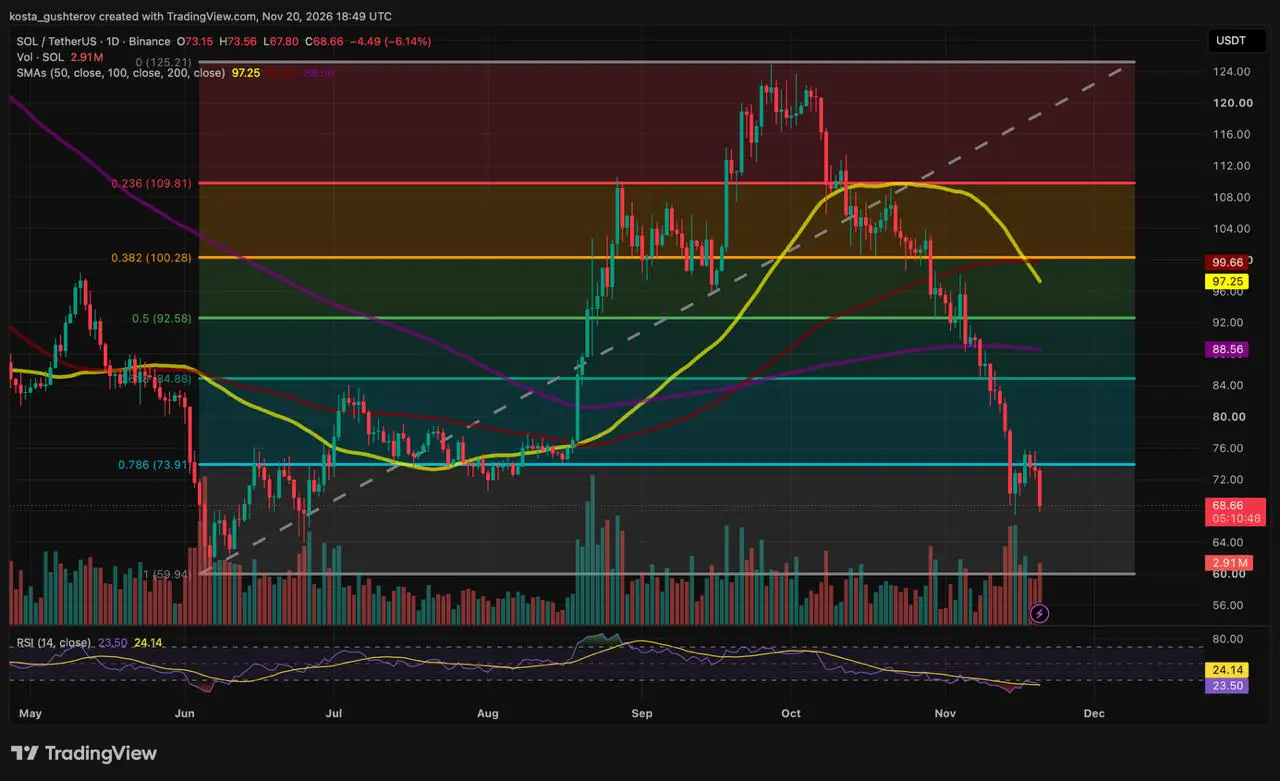
Chart: SOL/USDT daily, Binance, via TradingView, captured November 20, 2026, at 18:49 UTC with the daily candle still open. The Fibonacci retracement is drawn from the June low to the late-September high.
The November 17 close also raises the bar for any recovery. One close above $75 has already happened and reversed within a day, so a reclaim that counts would need to hold for more than one session.
From Floor to Ceiling
The same level played the opposite role a few months ago.
July-August
The floor
The $73-$75 area was the base of a summer range SOL traded in for weeks. The 50-day average turned up from that zone in August, and the range became the launch point for September’s run to $125.
November
The ceiling
Since the mid-November break, the level has capped the bounce. It is now the first level any recovery has to retake.
87% of the Summer Rally Is Gone
June low to September high: what’s left
$60 · June low
87% given back
$125 · September high
Teal: the share of the rally SOL still holds at about $69.
Measured from the June low near $60 to the late-September peak at $125, SOL has given back about 87% of the rally and sits 45% below the high. Above price, the 0.618 retracement near $85 and the 200-day average at $89 sit close together, forming the next resistance band after the 0.786 level. Below, the full retracement near $60 is the only labeled level left. It marks the June low that the whole Fibonacci grid is drawn from.
What June Actually Looked Like
The space between Friday’s price and the June low has trading history on it. After the early-June plunge to near $60, SOL spent weeks moving between that low and the level it is now testing from below, with long wicks in both directions and a late-June pullback into the lower part of the range. None of that range carries a labeled level on this chart, but buyers and sellers have traded there before. Friday’s low near $68 is the first line to watch. Under it, the June range is the reference all the way down to the full retracement near $60.
Averages Above, Momentum Stretched
All three daily averages sit above price: the 100-day at $100, the 50-day at $97 and the 200-day at $89. The 50-day has just slipped under the 100-day as it turns sharply lower. It is still above the 200-day, so this isn’t the 50/200 “death cross,” but SOL trades about 22% below even the lowest of the three.
Momentum points the other way. The 14-day RSI reads 23.5, well inside oversold territory, and it is still under its own average near 24.1, so it hasn’t turned up. On this chart, the only comparable reading came in early June, at the low the Fibonacci grid starts from. Readings this low can persist through a strong selloff, and they can also produce sudden short-covering spikes, so the oversold reading cuts both ways.
Volume favors the sellers, with a caveat. It spiked on the mid-November breakdown, faded during the bounce, and picked up again on Friday: 2.91 million SOL with hours still left in the session, already above the bounce days. The candle isn’t finished, though, and it is still lighter than the breakdown days.
Outside the Chart
SOL’s slide ran through a busy stretch for the network. Solana completed its move to 200-millisecond slots on October 9, halving its original 400-millisecond target, according to the Solana Foundation’s upgrade page. SOL was trading above $100 at the time. Last weekend the network dropped its “mainnet beta” label and adopted Solana 1.0 as a shared version number, a change that CoinDesk noted doesn’t make transactions faster or affect holders. The Solana Foundation’s Breakpoint conference ran in London from November 15 to 17. None of it slowed the decline, and neither did long-range valuation work such as Bitwise’s $1,100 scenario, whose assumptions run out to 2031.
Fund flows line up more closely with the chart. US spot Solana ETFs took in $271.6 million in September, as SOL rallied to its high, then saw $143.7 million in net outflows in October as the breakdown began, according to CoinDesk. On November 18, Roundhill asked the SEC to withdraw its proposed Solana covered-call ETF, which had never sold a share. Friday’s drop also came alongside the wider market: Bitcoin briefly fell tog around $59,000.
Three Ways Out
Continuation
● Bounces stall in the $72-$74 zone, under the 0.786 level
● Friday’s low near $68 gives way
● The $61-$60 area comes into play, just above and then at the June low
Reversal setup
● Price sweeps below the June low near $60
● A fast daily close back above it, a swing failure
● RSI prints a higher low, a bullish divergence
● Only then does the path toward $74, then $85, reopen
Invalidation
● A daily close back above $75-$76
● It holds for more than one session, unlike November 17
● Friday’s breakdown becomes a bear trap, with the $85-$89 band as the next resistance
These are conditions, not a forecast. Until one of them triggers, SOL sits between a level it has failed to hold twice in a week and a low it hasn’t tested since June.
Disclaimer: This article is for informational purposes only and does not constitute financial, investment or trading advice. The levels and scenarios above describe conditions on the chart, not predictions of future prices. Cryptocurrencies are highly volatile, and you should do your own research and consider your own risk tolerance before making any investment decision.
The post Solana Price Loses Its Summer Floor, June Low Back in View appeared first on Coindoo.