Solana price is back in the spotlight, and the conversation is getting interesting. After a sharp 8% recovery that lifted SOL from $68 to near $74, the fourth-largest proof-of-stake network b
Solana price is back in the spotlight, and the conversation is getting interesting. After a sharp 8% recovery that lifted SOL from $68 to near $74, the fourth-largest proof-of-stake network by transaction volume is now running straight into a wall that has tested bulls before.
The $75 level is not just a round number on a chart; it sits right where the 200-period Simple Moving Average is camped, turning this zone into one of the more consequential technical tests SOL has faced in recent weeks. With ETF inflows turning green and network activity accelerating, the real question is whether the fundamentals can do what short-term momentum alone cannot.
What the TD Sequential Sell Signal Actually Means for Solana Price
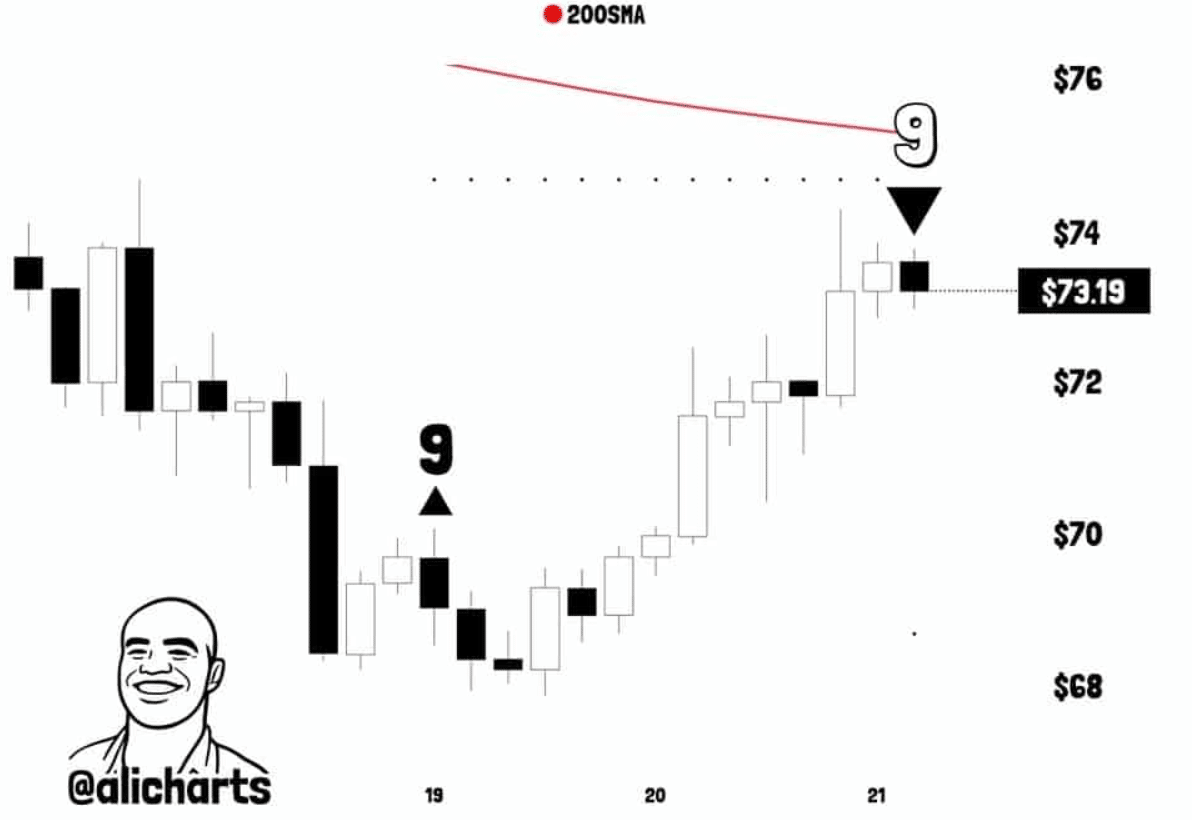
The TD Sequential is a time-based momentum indicator that counts Solana price bars to identify potential exhaustion points in a trend, and right now it is flashing a sell signal on the 4-hour chart. Traders who follow this tool closely know it does not always mean a dramatic reversal; more often than not, it flags a short-term cooldown before the broader move continues.
After the SOL Solana price gained roughly 8% from the $68 base last week following a TD Sequential buy trigger, the setup has now rotated to caution on shorter timeframes. A pullback toward $72 or even $70 is well within the probable range, which is normal behavior when an asset bumps into a supply zone reinforced by a major moving average like the 200 SMA.
ETF Inflows Tell a Different Story Beneath the Surface
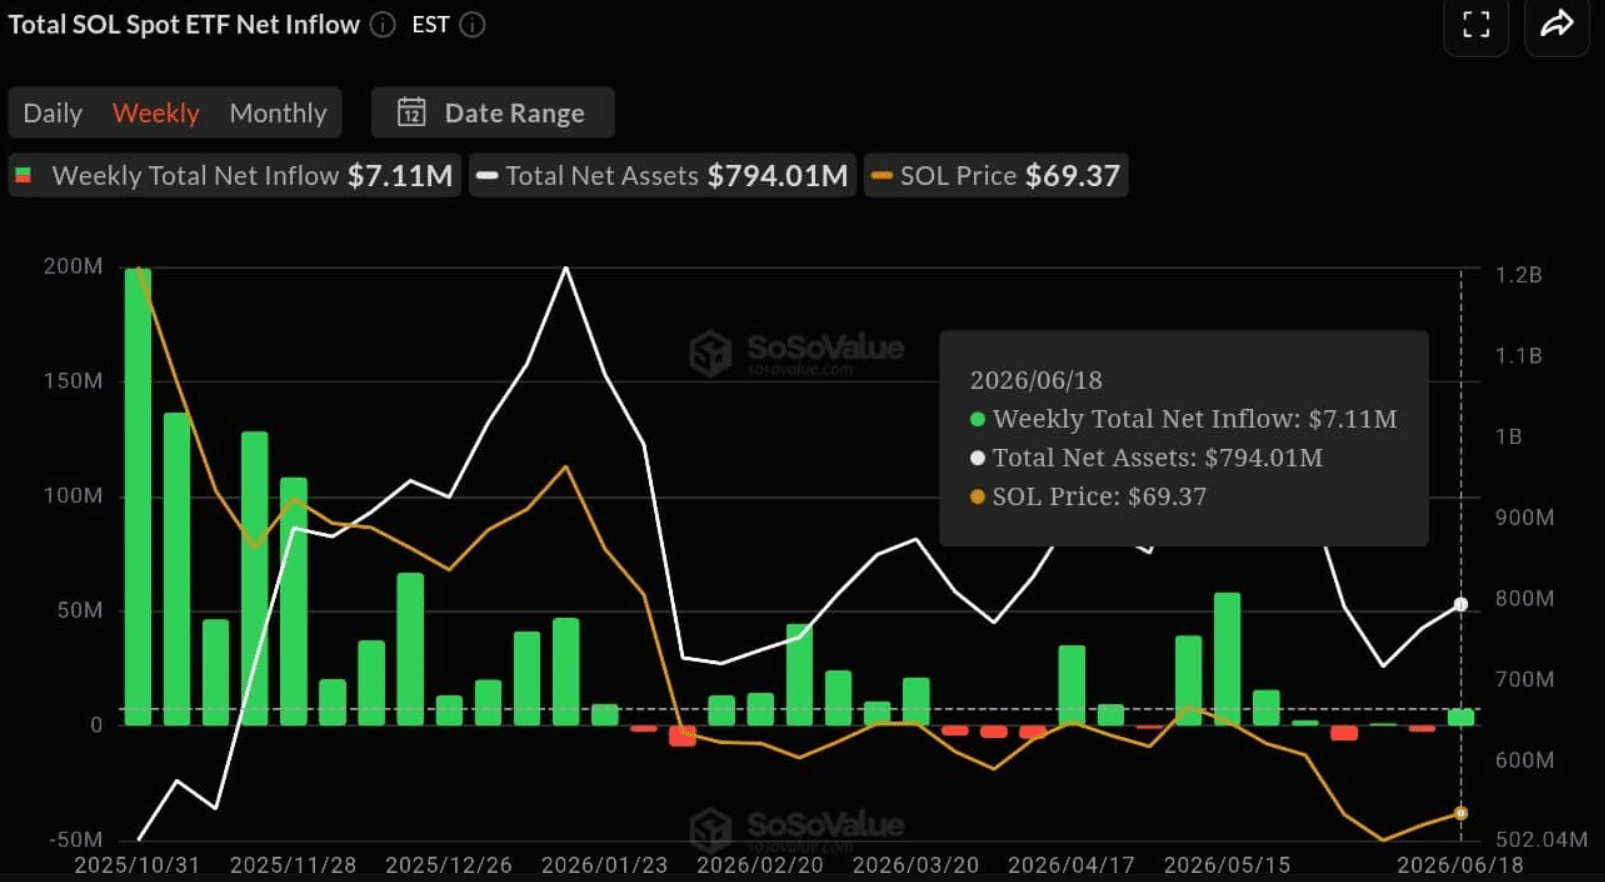
While the charts are sending mixed signals, the money flowing into Solana Spot ETFs is not. Net inflows over the past week crossed $7.11 million after previously sitting in negative territory at $2.54 million, and that kind of turnaround is worth paying attention to.
ETF flows reflect institutional and retail capital decisions, and when they flip from outflows to meaningful inflows, it suggests conviction is building outside of the speculative trading crowd. This is especially relevant given that the SOL Solana price recovery last week corresponded almost directly with the shift in ETF sentiment, reinforcing the idea that demand from structured investment products is genuinely influencing price action, not just following it.
On-Chain Activity Doubles Since January
Beyond the ETF narrative, the Solana network itself is running hot. Daily on-chain transactions have gone from roughly 60 million in January to 120 million at present, representing a full 100% increase in blockchain utilization over the span of a few months.
This kind of growth in real usage, covering decentralized applications, token transfers, and protocol interactions, gives the SOL Solana price a foundation that pure speculation does not offer. Network throughput at this scale points to genuine adoption, and historically, assets with expanding on-chain footprints tend to hold support levels more reliably during price corrections than those driven by hype cycles alone.
Key Levels to Watch Before Making Any Move
The immediate support below current prices sits at $68, which marked the recent higher low. If the SOL Solana price breaks that level with conviction, the next probable zone of interest is $60, a level that carries historical significance from prior consolidation periods.
On the upside, a clean break and daily close above $75 would shift the short-term technical picture considerably, opening room for a continuation toward $80 and beyond. Trading volume, which climbed over 20% to around $2.20 billion in 24 hours recently, will be a key confirmation signal in either direction. High volume on a breakout above $75 carries far more weight than a low-volume push that fades quickly.
Conclusion
Solana is not in free fall, nor is it running away to the upside just yet. The SOL Solana price is at a crossroads where technicals are urging caution but fundamentals are holding firm. ETF inflows returning to positive territory combined with transaction volumes doubling since January suggests the underlying ecosystem is healthy. Whether this week brings a breakout or a brief reset, the structure remains constructive as long as $68 holds as a support floor.
Disclaimer: This article is for informational purposes only and does not constitute financial or investment advice. Cryptocurrency markets are highly volatile.
Frequently Asked Questions
What is the current Solana price resistance level? The primary resistance is at $75, which coincides with the 200 SMA on the daily chart.
What does the TD Sequential sell signal mean for SOL? It indicates short-term momentum fatigue and the possibility of a minor price pullback, not necessarily a major trend reversal.
How much have Solana ETF inflows changed recently? Net inflows shifted from negative $2.54 million to positive $7.11 million within a week, signaling renewed investor interest.
What happens if Solana drops below $68? A confirmed break below $68 could extend the decline toward the $60 support level.
Glossary of Key Terms
TD Sequential: A technical indicator that uses a sequence of price bars to identify potential trend exhaustion and reversal points.
200 SMA (Simple Moving Average): The average closing price of an asset over 200 periods, widely used as a benchmark for long-term trend direction.
Resistance Level: A price zone where selling pressure has historically been strong enough to pause or reverse an uptrend.
ETF Inflows: Capital entering an Exchange-Traded Fund, which for crypto products reflects broader investor demand for regulated exposure to digital assets.
On-Chain Transactions: Verified activity recorded directly on the blockchain, including transfers, contract interactions, and protocol usage.
Support Level: A price floor where buying interest tends to emerge, preventing further decline in an asset.
4-Hour Chart: A trading view where each candlestick represents four hours of price activity, commonly used for short to medium-term analysis.
Source
ambcrypto