Key Highlights SOL trades at $96.63 (-3.68% 24h) with $56.72B market cap as ETF inflow data contradicts short-term price weakness Nine consecutive weeks of net inflows into US spot SOL ETFs —
Key Highlights
- SOL trades at $96.63 (-3.68% 24h) with $56.72B market cap as ETF inflow data contradicts short-term price weakness
- Nine consecutive weeks of net inflows into US spot SOL ETFs — zero outflow weeks — with $200M+ entering in the past 30 days per @alicharts via Santiment
- Peak single-week inflow reached ~$120M on August 24; current baseline floor is $12–15M weekly
- Re-acceleration threshold to watch: weekly net inflows above $50M would signal a bullish second wave of institutional demand
Solana is trading at $96.63 — down 3.68% in the past 24 hours — with a market cap of $56.72 billion and $3.90 billion in 24-hour volume. Behind the short-term price weakness sits a structural data point that cuts directly against the bearish reading: nine consecutive weeks of net inflows into US spot SOL ETFs, with no single outflow week recorded across that entire stretch.
This is the signal that crypto analyst Ali Charts (@alicharts) elevated in a thread published September 16, 2026, noting: “While this support holds, demand from US spot SOL ETFs continues to rise. Solana has recorded nine consecutive weeks of net inflows, with more than $200 million flowing into spot SOL ETFs over the past month alone.” The framing is deliberate — inflow continuity while price holds a support level is a structurally different signal from a single-week spike followed by normalization.
Signal — Nine Consecutive Weeks, Zero Outflow Weeks
The core data point is not the dollar amount alone — it is the unbroken sequence. Nine consecutive weeks of net positive flows means institutional participants have not used a single weekly period to reduce ETF exposure. That is the structural distinction between a speculative burst and a demand floor being established.
The Santiment data cited by @alicharts covers weekly SOL spot ETF net flows from July 27 through September 7, 2026. The weekly breakdown reveals three distinct phases:
PeriodWeekly Net FlowPhaseJul 27 – Aug 3Near zero / minimalAccumulation onsetAug 17~$55MAccelerationAug 24~$120M (peak)Maximum inflow weekAug 31 – Sep 7~$12–15M eachNormalization / floor
Source: Santiment via @alicharts (X), September 2026
The August 24 peak of ~$120 million in a single week represents the highest single-week institutional commitment in this nine-week run. That the following two weeks settled at $12–15M rather than flipping negative is the critical structural detail: buying intensity moderated, but the directional commitment did not reverse.
The cumulative result: more than $200 million in net inflows over the past 30 days from US spot SOL ETFs alone, per @alicharts citing Santiment data.
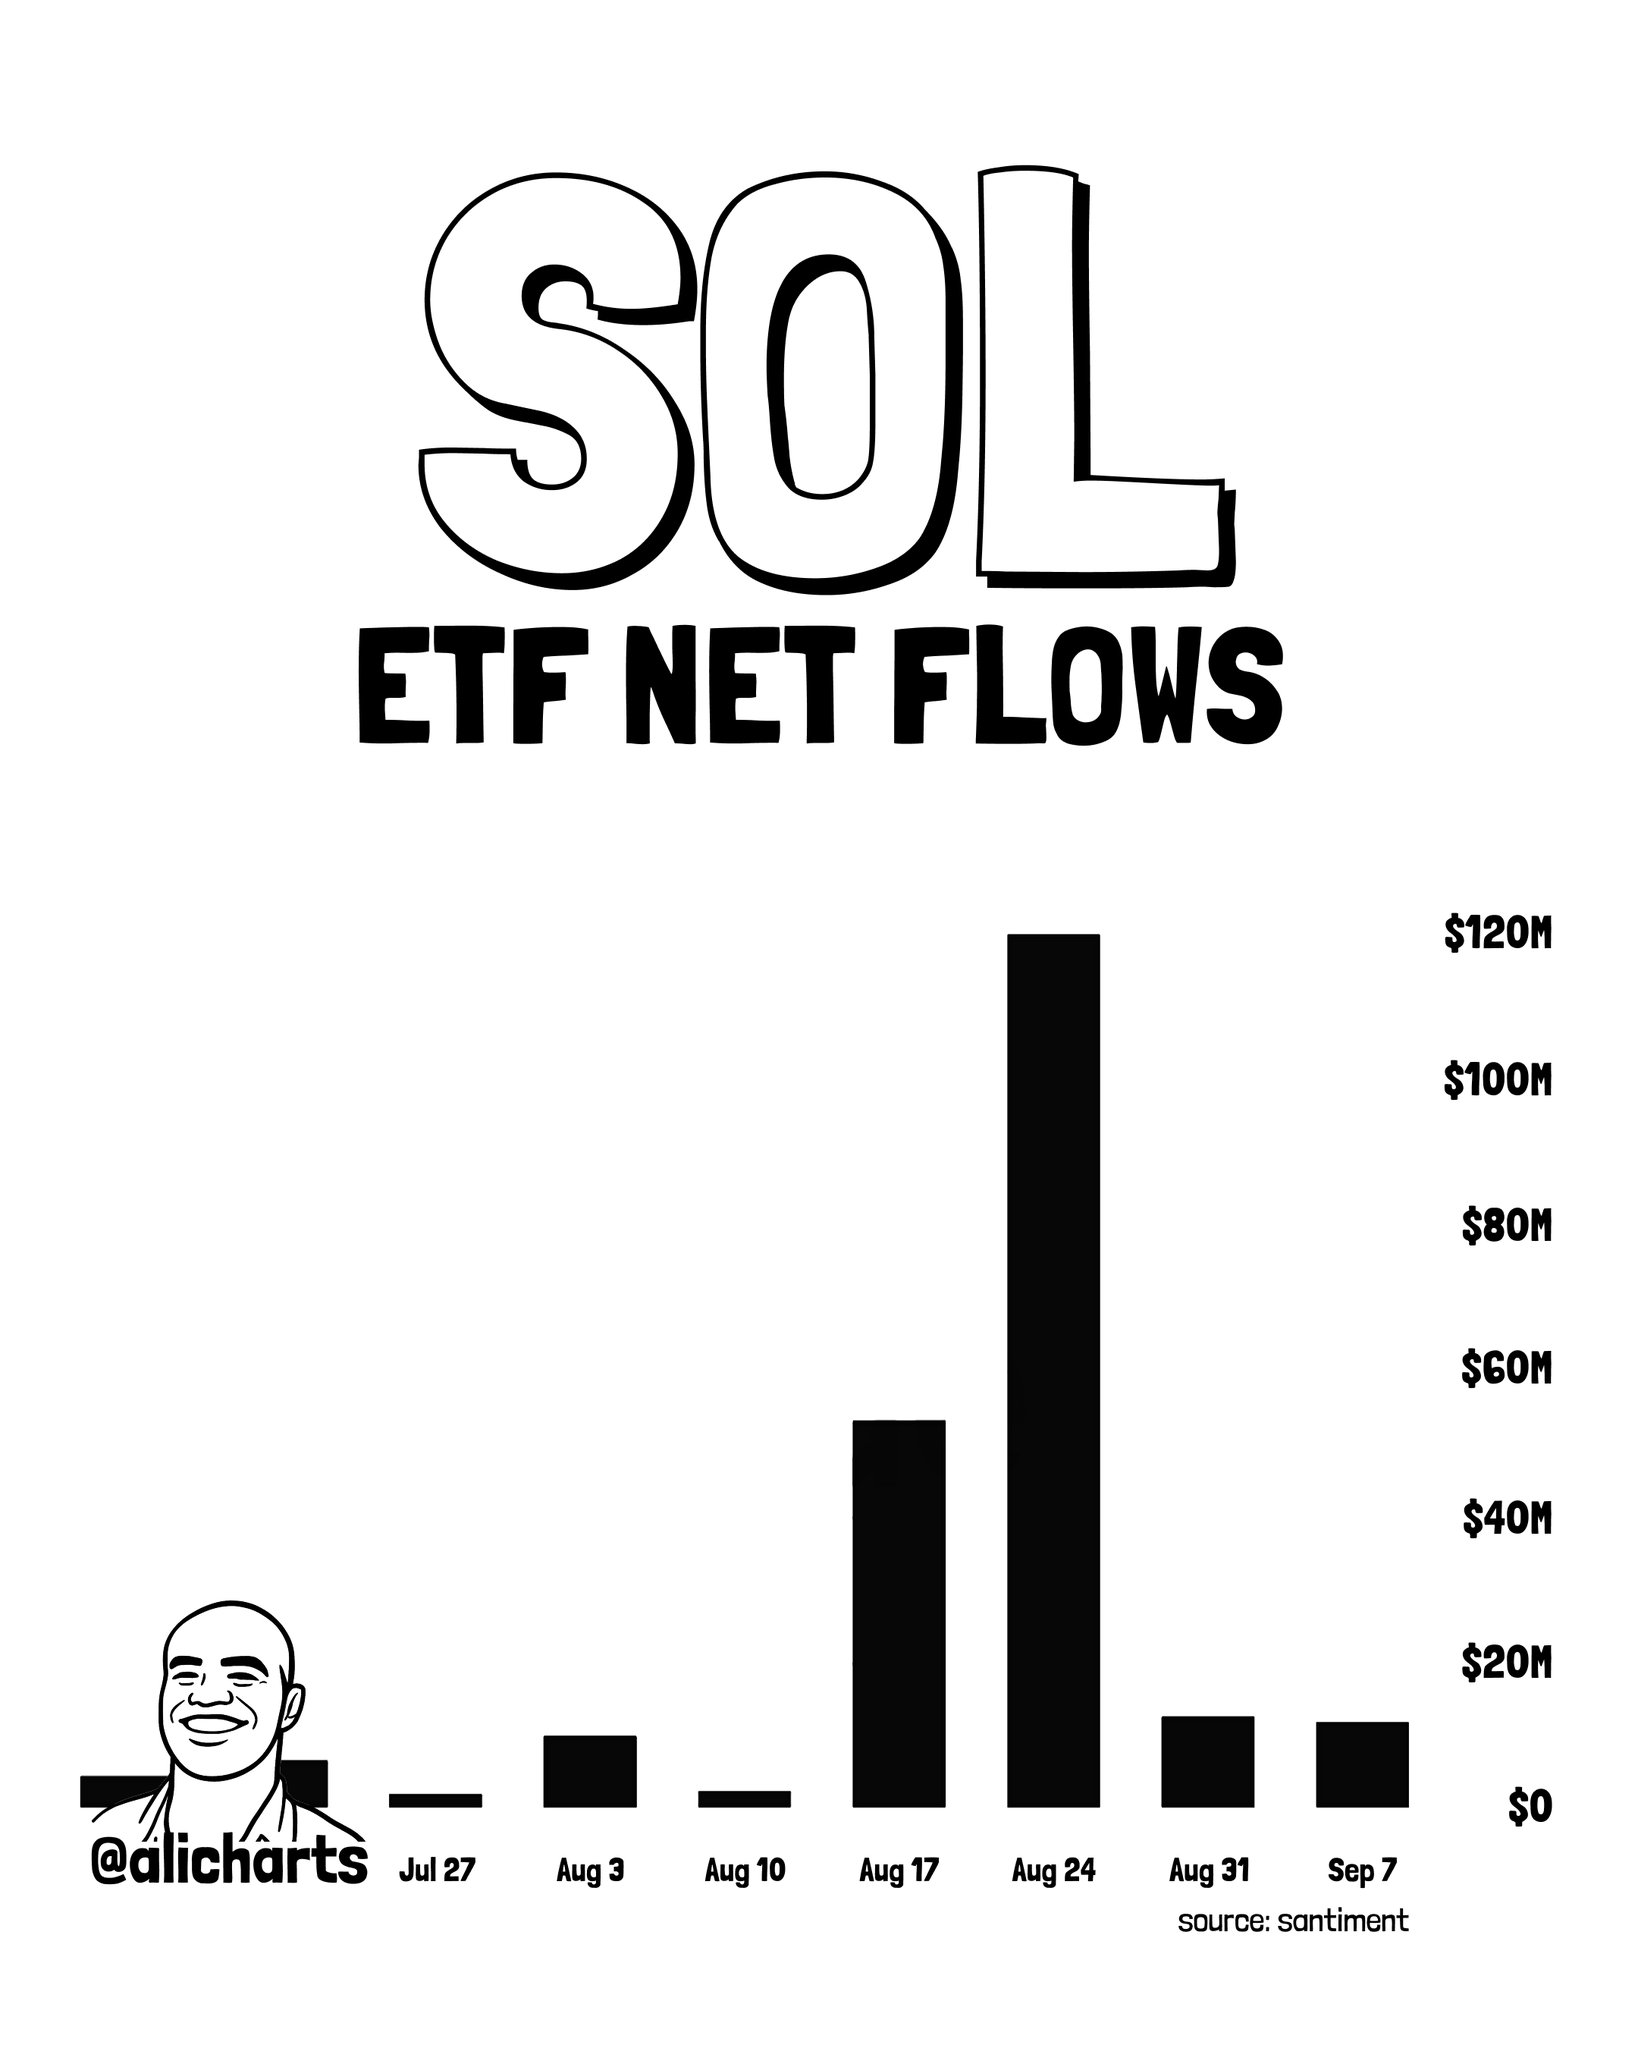 Chart via @alicharts (X)
This sustained institutional accumulation pattern complements the broader supply dynamics covered in our earlier report on how Solana exchange supply dropped by 3 million SOL — a supply squeeze developing in parallel with rising ETF demand.
What the ETF Flow Data Actually Measures — And What It Doesn’t
ETF net flow data measures the net change in shares outstanding — a direct proxy for institutional capital entering or leaving the product. A positive week means the ETF issuer purchased more SOL on the open market to back new shares. A negative week means the reverse. Nine consecutive positive weeks means nine consecutive weeks of net SOL purchases by ETF issuers on behalf of institutional allocators.
What the data does not say:
- It does not specify at what prices these institutions allocated — cost basis is unknown from flow data alone
- It does not confirm whether the inflow pace will accelerate, sustain, or normalize further toward zero
- It does not guarantee price follows institutional accumulation on any specific timeframe
What the data does confirm with certainty:
- No week of net selling across nine weeks — the directional commitment has been one-sided
- A $12–15M weekly floor has established itself in recent weeks, suggesting a baseline demand rate rather than a fading spike
- The flow pattern mirrors a classic institutional accumulation profile: spike → normalization → sustained baseline — not the flash-and-fade pattern of speculative inflows
The Re-Acceleration Threshold — What to Watch
@alicharts’ chart analysis establishes a clear forward-looking metric: a resumption of weekly inflows above $50 million would constitute a bullish re-acceleration signal. The August 24 peak of ~$120M demonstrated that demand capacity exists at that level. The question is whether macro conditions or a price catalyst triggers a second wave of institutional commitment above the $50M threshold.
At the current $12–15M weekly baseline, the annualized run rate implies roughly $650–780M in annual institutional inflows at current pace — a structurally significant number for an asset with a $56.72B market cap. An acceleration back above $50M weekly would lift the implied annual rate to $2.6B+, a regime shift that would directly alter the supply/demand balance for SOL in spot markets.
The metric to track: Santiment’s weekly SOL spot ETF net flow figures, specifically whether the $50M threshold is reclaimed in any single week over the coming month.
Bullish and Bearish Scenarios
Bullish Scenario — Flow Re-Acceleration Above $50M
If weekly net inflows recover above $50 million — matching the August 17 secondary peak — it signals that the post-August 24 normalization was a consolidation rather than a trend reversal. In that scenario, the nine-week streak extends with renewed velocity, institutional cost basis drops toward current levels (~$96), and the supply squeeze documented by exchange outflows of 3 million SOL compounds into a structurally tighter market. Price target in this scenario depends on broader market structure, but the demand floor would be significantly reinforced.
Bearish Scenario — First Outflow Week Breaks the Streak
The nine-week streak carries weight precisely because it is unbroken. If a single week registers net outflows — meaning ETF issuers are redeeming shares and selling SOL — the structural narrative shifts. A first outflow week at current prices near $96 would suggest institutional holders are reducing exposure into this support zone rather than accumulating into it. That would be the first clean bearish signal from the ETF flow data since the streak began July 27. Watch the weekly Santiment print: any negative reading breaks the nine-week streak and warrants reassessment.
Bottom Line
The nine-week, zero-outflow ETF inflow streak documented by @alicharts using Santiment data is a structural signal — not a price prediction, but a confirmation of sustained institutional directional commitment. More than $200 million entered US spot SOL ETFs over the past 30 days, with a peak single-week reading of ~$120 million on August 24 and a normalized floor of $12–15M per week in the two subsequent weeks. The streak is intact. The baseline demand is positive.
The re-acceleration signal requires a weekly print above $50 million. At $96.63 and a market cap of $56.72 billion, Solana’s price weakness stands in direct contrast to the institutional behavior the ETF flow data is recording. Watch the next weekly Santiment ETF flow print — specifically whether it holds above zero — as the single most important real-time indicator of whether this structural demand floor is holding or beginning to crack.
Disclaimer: The views and analysis presented in this article are for informational purposes only and reflect the author’s perspective, not financial advice. Technical patterns and indicators discussed are subject to market volatility and may or may not yield anticipated results. Investors are advised to exercise caution, conduct independent research, and make decisions aligned with their individual risk tolerance.
Also Read: Solana Exchange Supply Drops 3 Million SOL — What the Supply Squeeze Means for Price