Solana has been on a downward trend ever since it hit $67.50 resistance, and a potential failure could lead to the next major support level around $40. Rising open interest and falling future
- Solana has been on a downward trend ever since it hit $67.50 resistance, and a potential failure could lead to the next major support level around $40.
- Rising open interest and falling futures volume suggest traders remain exposed, while liquidations continue showing pressure across leveraged positions.
- Futures positioning remains divided, with positive funding and long-heavy accounts contrasting against declining prices and substantial liquidation activity.
After months of falling prices, Solana is nearing an important support level, but futures positioning and the overall market landscape make a recovery difficult.
Solana Faces Pressure Near Long-Term Support
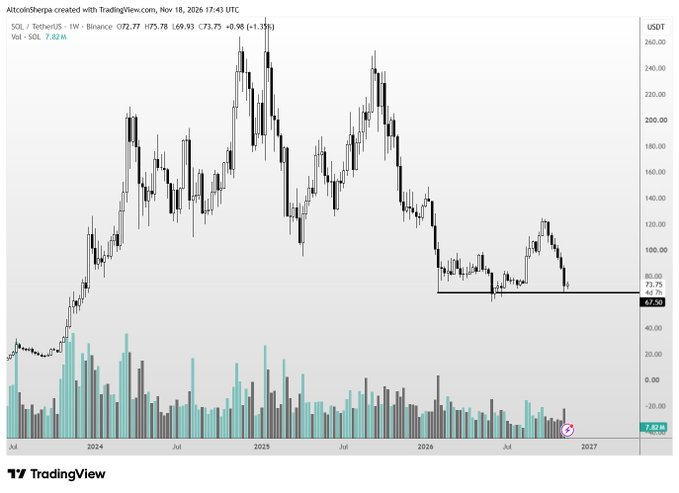
Despite the ongoing uncertainty, the supplied commentary by analyst AltcoinSherpa suggests that Solana may be in the process of forming a bottoming pattern. What is seen on the weekly chart is a long run down from previous highs above $260. Recovery efforts have been curtailed recently and the price is near the bottom of the trading range.
Source:
X
The horizontal support is marked at $67.50, which is near the area of consolidation seen previously. Trades are currently around $74.41 where there is not much room to distribute from. The market's action here will play into whether buyers will make another recovery attempt.
Previous rallies brought about significant gains, but the gains were reversed by sellers. The recent rally to $120 was weak and unable to keep the momentum going, bringing price back down into the lower half. This means that while there are signs of recovery, they are weak ones and not improvements.
The current bear market has also weakened the preceding bull market. The unsuccessful recovery attempts have left lows taking over the chart. This makes the marked support upwards more and more relevant to those traders following the next move.
$67.50 Support Remains the Critical Level
The $67.50 level is the principal support identified on the weekly chart. It represents an area where price previously spent time consolidating. That earlier activity makes the region relevant during the current decline.
Buyers support is in place and if they are not ready to give up on the price, it may set up another base for the price to recover from. But a trading in support by itself would not establish a wider trend change. If it was stronger it would need the buyers to keep coming and the price action to improve following.

The provided commentary has marked around $40 as the next downside risk possibility. That is more of an issue if the existing support tanks are badly beaten. Such a drop would take the correction well outside of the current range.
Bitcoin has an uncertain outlook, thus there is an additional factor to include in the support test. A broad sell-off in the cryptocurrency market may create selling pressure. Therefore, the strength of the support area might be partly influenced by the broader market environment.
Futures Positioning Shows Conflicting Signals
Derivatives data presents a mixed picture, with open interest rising 0.58% to $4.15 billion. Meanwhile, futures volume declined 14.22% to $4.67 billion during the reported period. Spot volume also fell 23.45%, reaching approximately $523.39 million.
Funding is still slightly positive at 0.0030%, indicating a slight cost to holding long positions. Derivatives trading are much higher, with the futures-to-spot volume ratio at 8.9. When considering short term price action, leveraged positioning becomes a key factor in this focus.
The liquidation figures show significant leverage pressures in all positions. There were $209,020 in one hour liquidations and $319,750 in four hour liquidations. The majority of liquidations were long positions in both shorter periods.
But the 12-hour figures revealed a different balance among traders. Total liquidations were $2.89 million, about $2.49 million of which was in shorts. The overall window, then, saw more forced bearish closing of positions.
Liquidations over the 24 hours totalled almost $9.97 million, while longs added $5.86 million. Shorts contributed about $4.12 million over the same time as well. Despite the conflicting signals, the weekly chart continues to be bearish, so looking for support is the next focus.