Sonic is quietly grinding lower today with barely any leveraged activity behind the move, a sign the market is watching rather than forcing a direction. This Sonic Price Prediction August 202
Sonic is quietly grinding lower today with barely any leveraged activity behind the move, a sign the market is watching rather than forcing a direction.
This Sonic Price Prediction August 2026 covers the trendline breakdown, EMA and resistance levels, oversold RSI, and the Fibonacci supports below.
Sonic, previously known as Fantom, is a high-throughput smart contract platform designed for fast, low-cost transactions, according to its own project materials.
Stay till the end for the full bull and bear case.
Sonic Price Prediction: Market Overview and S Price Movement
Metric
Value
Price
$0.02112
24h Change
−0.1%
Market Cap
$60.72M (−0.1%)
24h Volume
$5.61M (+56.12%)
Vol/Mkt Cap (24h)
9.25%
FDV
$67.94M
Total Supply
3.22B S
Max Supply
∞ (uncapped)
Circulating Supply
2.88B S
Profile Score
74%
Source: Data from CoinMarketCap as of 31/07/2026. Figures may vary slightly across other tracking websites.
Sonic Liquidation and Volume Data
Liquidation activity on $Sonic (previously FTM) is unusually thin, per Coinglass: 1h totals just $3.16, all short; 4h totals $279.19, mostly long ($276.04); 12h totals $7.13K, split $7.11K long versus $13.54 short; 24h totals $10.44K, with $9.35K long versus $1.10K short. 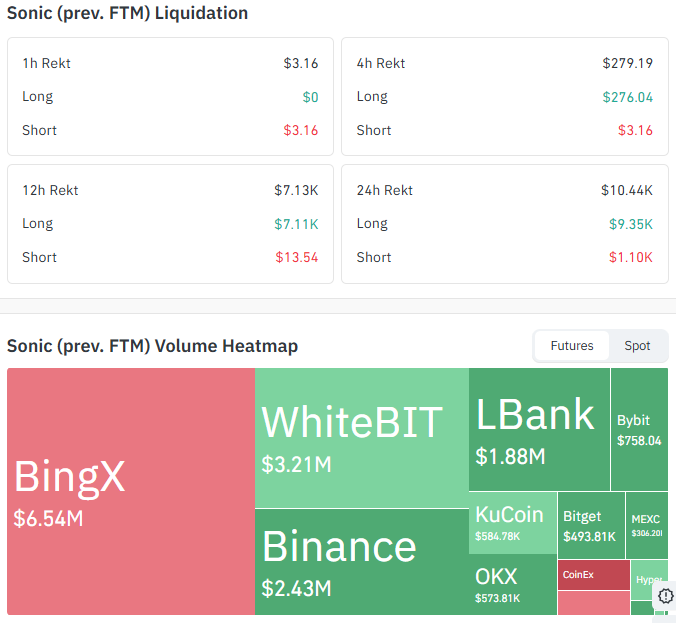
Source: Data From CoinGlass
With such small totals across every window, this isn't a market being driven by forced liquidations right now.
On futures volume, BingX leads at $6.54M, followed by WhiteBIT ($3.21M) and Binance ($2.43M), with smaller volume across LBank, Bybit, OKX, KuCoin, Bitget, MEXC, CoinEx, and Hyperliquid.
This is separate from the $5.61M spot volume in the overview above.
Sonic Prediction Chart: Technical Analysis
Pair: $Sonic/Tether · Market: Spot (Crypto) · Timeframe: 1D · Source: TradingView, KuCoin · Timestamp: July 31, 2026, 17:22 UTC+5:30
S trades at $0.02112. The chart shows $Sonic broke down out of a long ascending trendline it had held since the spring, with that breakdown accelerating through June inside a short descending channel before price fell further to current levels.
Current price sits below both key EMAs, with the EMA 20 at $0.02341 and the EMA 50 at $0.02657 listed separately from the horizontal resistance levels above, since both EMAs sit just above current price as their own near-term resistance.
The structure stays bearish until the price breaks above $0.02341 and trades above both EMAs. RSI(14) reads 30.60, just above the oversold threshold after dipping below it in late June.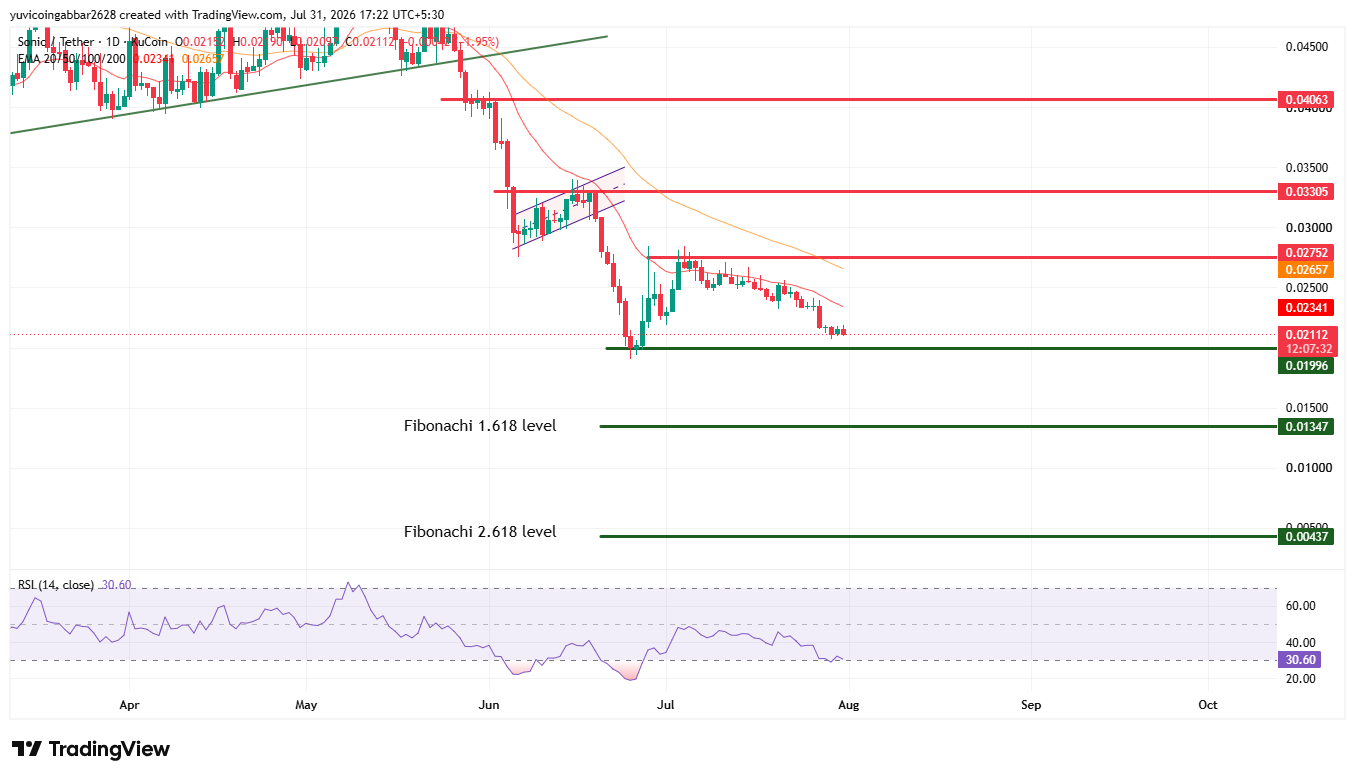
Level Type
Price
Resistance 3
$0.04063
Resistance 2
$0.03305
Resistance 1
$0.02752
EMA 50 (near-term resistance)
$0.02657
EMA 20 (near-term resistance)
$0.02341
Immediate Price Reference
$0.02112
Support 1
$0.01996
Support (Fibonacci 1.618)
$0.01347
Support (Fibonacci 2.618)
$0.00437
The EMA 20 ($0.02341) and EMA 50 ($0.02657) are listed separately from the horizontal resistance levels above, since both EMAs now sit just above the current price. The structure stays bearish until the price breaks above $0.02341 and trades above both EMAs.
Sonic Forecast August 2026: Bull Case vs. Bear Case
Bull case: If S reclaims the EMA 20 at $0.02341 and then the EMA 50 at $0.02657, that would open the door to a retest of Resistance 1 at $0.02752. A break above that would put $0.03305 and eventually $0.04063 in view. RSI near oversold levels leaves some room for a relief bounce even without a change in trend.
Bear case: A continued slide below Support 1 at $0.01996 would open room toward the Fibonacci 1.618 support at $0.01347, with $0.00437 as the deeper Fibonacci 2.618 level if the breakdown extends that far. Thin liquidation activity means there's little forced flow either way to slow the move down.
Can S Reach the Sonic Price Target of $0.03305?
A move to $0.03305 would require $Sonic to first reclaim both EMAs and Resistance 1 at $0.02752, then hold above that zone on a sustained basis.
That would mark a full reversal of the trendline breakdown that's been in place since spring, so it's a bigger ask than a short-term bounce off oversold RSI.
What Could Invalidate the Sonic Bullish Forecast?
A confirmed daily close below $0.01996 would undercut the near-term recovery case and point toward the Fibonacci 1.618 support at $0.01347. A further break below that would open the room toward $0.00437 if the breakdown continues.
Sonic Short-Term Forecast: A Liquidation-Based Read
With total liquidations staying in the low thousands across every window, per Coinglass, there's no meaningful forced-selling or short-squeeze signal driving this move right now. The price action looks more like organic drift than a leverage-fueled swing, which means the RSI and trendline structure carry more weight in this read than the liquidation data does.
Sonic Price Prediction Methodology
This forecast draws on multiple inputs rather than a single chart pattern: the ascending trendline breakdown, EMA positioning relative to price, horizontal resistance and support levels, RSI momentum, Fibonacci extension levels, and recent liquidation activity. No single data point is treated as decisive on its own.
Sonic Price Prediction August 2026: Expert View
According to CoinGabbar analysts, Sonic's chart shows a coin still working through the aftermath of its spring trendline breakdown, with the EMA 20 and EMA 50 sitting just overhead as near-term resistance separate from the larger horizontal levels above.
RSI near 30 suggests the sharpest part of the selling may be behind it, though the unusually light liquidation activity means there's little leveraged pressure to force a reversal either way.
The near-term question is whether $0.01996 holds as support or whether the move extends toward the Fibonacci supports below.
Sonic Price Prediction August 2026: Data Sources
Price, market cap, and supply data referenced from a CoinMarketCap-style tracker, snapshot taken July 31, 2026. Liquidation and futures volume data referenced from Coinglass, as of July 31, 2026. Chart analysis (EMA, RSI, resistance, support, Fibonacci) sourced from a 1D $Sonic/Tether chart on TradingView (KuCoin data), timestamped July 31, 2026, 17:22 UTC+5:30.
Disclaimer: This piece is for informational purposes only and isn't financial advice. Crypto prices are volatile, and it's worth doing independent research before acting on any of the levels discussed here.