SPX6900 ($SPX) is a satirical memecoin built around the idea of "number go up" market commentary, positioning itself as a tongue-in-cheek alternative to the S&P 500 index. It currently trades
SPX6900 ($SPX) is a satirical memecoin built around the idea of "number go up" market commentary, positioning itself as a tongue-in-cheek alternative to the S&P 500 index.
It currently trades around $0.4332, down slightly over the past day after a sharp weekly pullback.
This SPX6900 price prediction looks at where SPX could head next based on its daily chart structure, EMA positioning, and derivatives data.
Live Market Data
Metric
Value
Price
$0.4332
24h Change
-1.6%
24h Range
$0.4306 - $0.4938
Market Cap
$403.26M
Fully Diluted Valuation
$403.26M
24h Trading Volume
$22.076M
Circulating Supply
930.987M
Total Supply
930.987M
Max Supply
1B
Source: $SPX market cap data taken from Coingecko, data as of Aug 22, 2026. Figures may vary slightly across other tracking websites.
Liquidation Snapshot
Window
Total Liquidated
Longs
Shorts
1 Hour
$1.94K
$1.93K
$7.50
4 Hour
$9.82K
$9.82K
$7.50
12 Hour
$222.84K
$157.65K
$65.19K
24 Hour
$250.57K
$160.11K
$90.46K
Source: Liquidation Data Taken From Coinglass.
Longs have taken the heavier hit in every window tracked, which fits with the pullback into the FVG zone after the initial breakout spike.
It suggests some leveraged buyers jumped in too early on the retest rather than waiting for confirmation.
Exchange Volume
Futures trading in SPX6900 is led by Binance, with $16.20M in 24-hour volume, followed by Bybit at $10.97M and BingX at $7.10M.
MEXC, Hyperliquid, KuCoin, OKX, and Bitget make up the smaller remaining share. 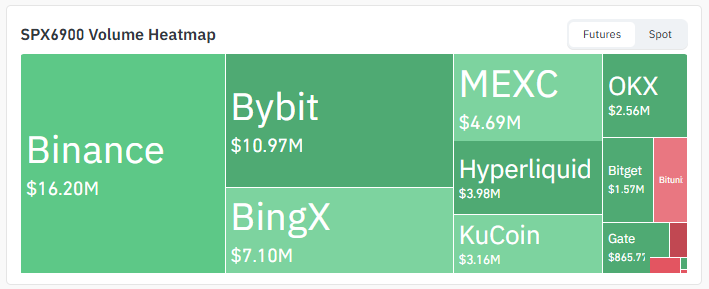
Source: Volume Heatmap Data Taken From Coinglass.
Volume here is noticeably thinner than larger-cap tokens, so price swings in this SPX6900 price prediction can move faster in either direction on comparatively modest order flow.
Key Takeaways
SPX6900 trades near $0.4332, down 1.6% over 24 hours, after a volume-backed breakout from a falling wedge on the daily chart.
The breakout left behind a fair value gap that price is now retesting, a level this SPX6900 price prediction treats as the key decision zone.
A successful bounce from the FVG opens a path toward $0.4974, then $0.5591 and $0.6553.
Failure to hold this zone risks a slide back toward $0.3598 and potentially $0.3091.
Long positions have taken the larger share of liquidations across every timeframe, including the sharpest hit over the past 24 hours.
Technical Analysis
Daily Chart: Wedge Breakout Meets Its First Retest
SPX had been coiling inside a falling wedge for weeks, and it finally broke out with a real volume spike behind it, not a quiet drift higher.
That sharp move left a fair value gap on the chart, and the price has now come back down to retest it directly. 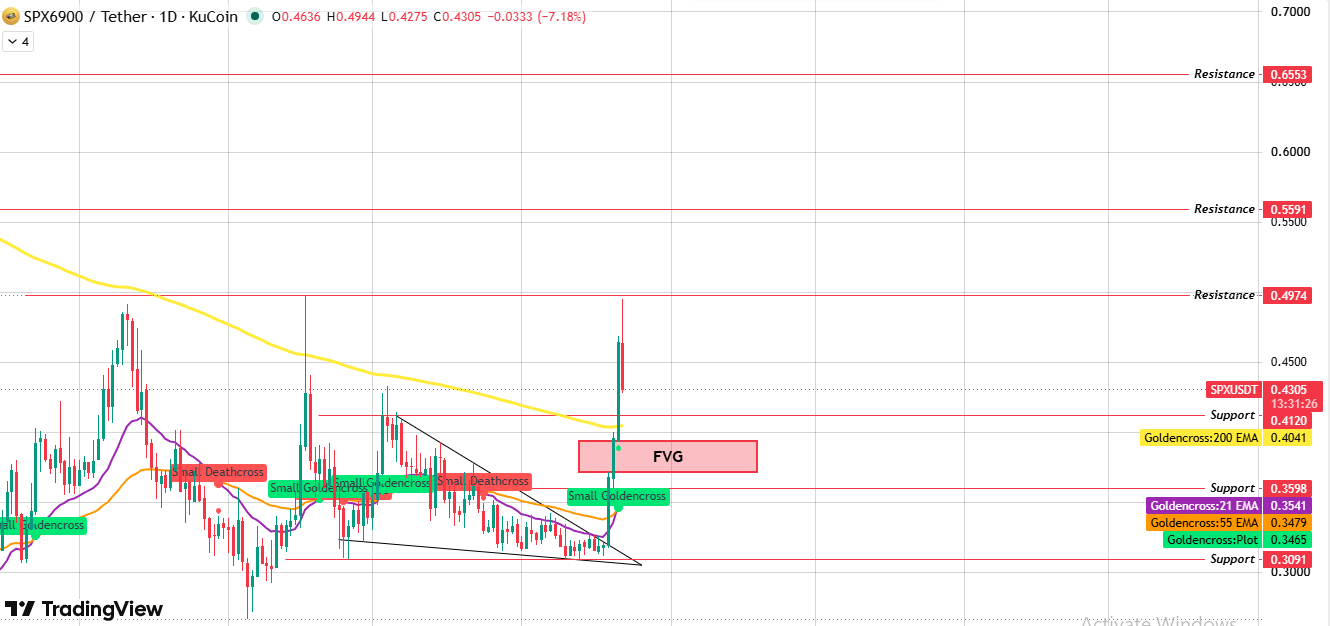
Source: Chart Taken From TradingView.
This SPX6900 price prediction comes down to how that retest plays out.
A bounce off the FVG would confirm the breakout was genuine and reopen the path toward $0.4974, with $0.5591 and $0.6553 as extended levels if momentum builds further.
But if the price can't hold this zone and slips through it instead, the setup weakens fast, with $0.3598 and then $0.3091 becoming the levels to watch on the way down.
EMA Levels
EMA
Value
200 EMA
$0.4041
21 EMA
$0.3541
55 EMA
$0.3479
Price is currently trading above all three major EMAs, and the 200 EMA sitting just below the FVG support zone adds another layer of confluence to that level.
A small golden cross has already formed on the shorter EMAs, which lines up with the wedge breakout and adds some technical weight to the bullish side of this SPX6900 price prediction, provided the FVG retest holds.
Support and Resistance Levels
Level Type
Price
Resistance 3
$0.6553
Resistance 2
$0.5591
Resistance 1
$0.4974
Current Price
$0.4332
FVG / Support Zone
$0.4120
Support 1
$0.3598
Support 2
$0.3091
Bull, Base, and Bear Case
Scenario
Setup
level
Invalidation
Bull
FVG holds as support, and buyers step back in.
$0.4974 - $0.6553
Below $0.4120
Base
Price chops inside the FVG zone, deciding direction
$0.4120 - $0.4974
Break of $0.3598
Bear
FVG fails to hold, support breaks
$0.3598 - $0.3091
Below $0.3091
Glossary
Falling Wedge:A chart pattern where price compresses between two converging downward-sloping lines. A breakout to the upside, especially on rising volume, is typically read as a bullish reversal signal.
Fair Value Gap (FVG): A price zone left behind when a sharp move skips over normal trading activity. Price often returns to these zones later, either bouncing off them or breaking straight through.
Golden Cross:A bullish signal that occurs when a shorter-term moving average crosses above a longer-term one, often seen as an early sign of trend strength.
EMA (Exponential Moving Average):A moving average that weights recent price data more heavily than older data, making it more responsive to short-term price changes than a simple moving average.
Liquidation: The forced closing of a leveraged futures position when losses exceed the trader's available margin. A cluster of long liquidations during a pullback usually points to buyers entering too early.
Retest: When a price returns to a previously broken level, such as a wedge boundary or an FVG, to confirm whether that level now acts as support or resistance.
Methodology
This SPX6900 price prediction is built from daily chart technical analysis, EMA positioning, live liquidation and futures volume data from Coinglass, and current market data.
All price levels referenced come directly from the chart provided, with no extrapolated or speculative level.
Disclaimer: This article is for informational purposes only and does not constitute financial, investment, or trading advice. Cryptocurrency markets, including SPX6900, are highly volatile and speculative. Any price levels, levels, or scenarios discussed are probability-based observations drawn from technical data, not guarantees. Please conduct your own research and consult a qualified financial advisor before making investment decisions.