The $2 Trillion Stablecoin Map: Where Digital Dollars Really Go Stablecoin flows are the movements of dollar-linked tokens between wallets, exchanges, and countries. The total depends on what
The $2 Trillion Stablecoin Map: Where Digital Dollars Really Go
Stablecoin flows are the movements of dollar-linked tokens between wallets, exchanges, and countries. The total depends on what you count.
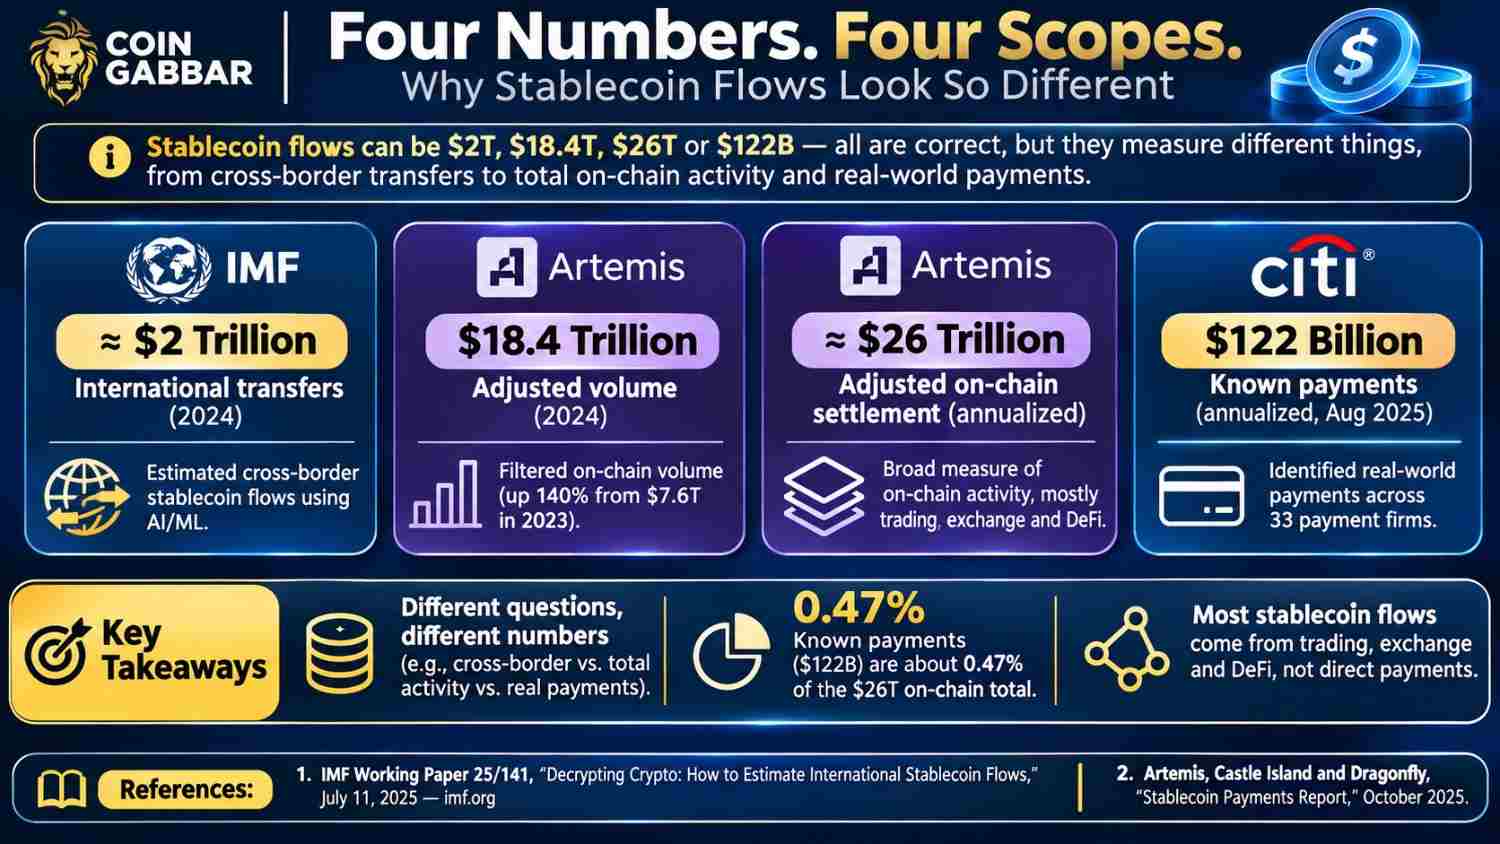
Four respected sources give four very different numbers: $2 trillion, $18.4 trillion, $26 trillion, and $122 billion. All describe 2024 or 2025. This guide shows why each is right for its own scope. Our guide to how stablecoins work covers the basics.
Most stablecoin flows come from trading, exchange, and DeFi activity. Payments are a small slice of stablecoin flows. The IMF maps about $2 trillion of cross-border transfers in 2024. Artemis finds known payments run at $122 billion a year as of August 2025.
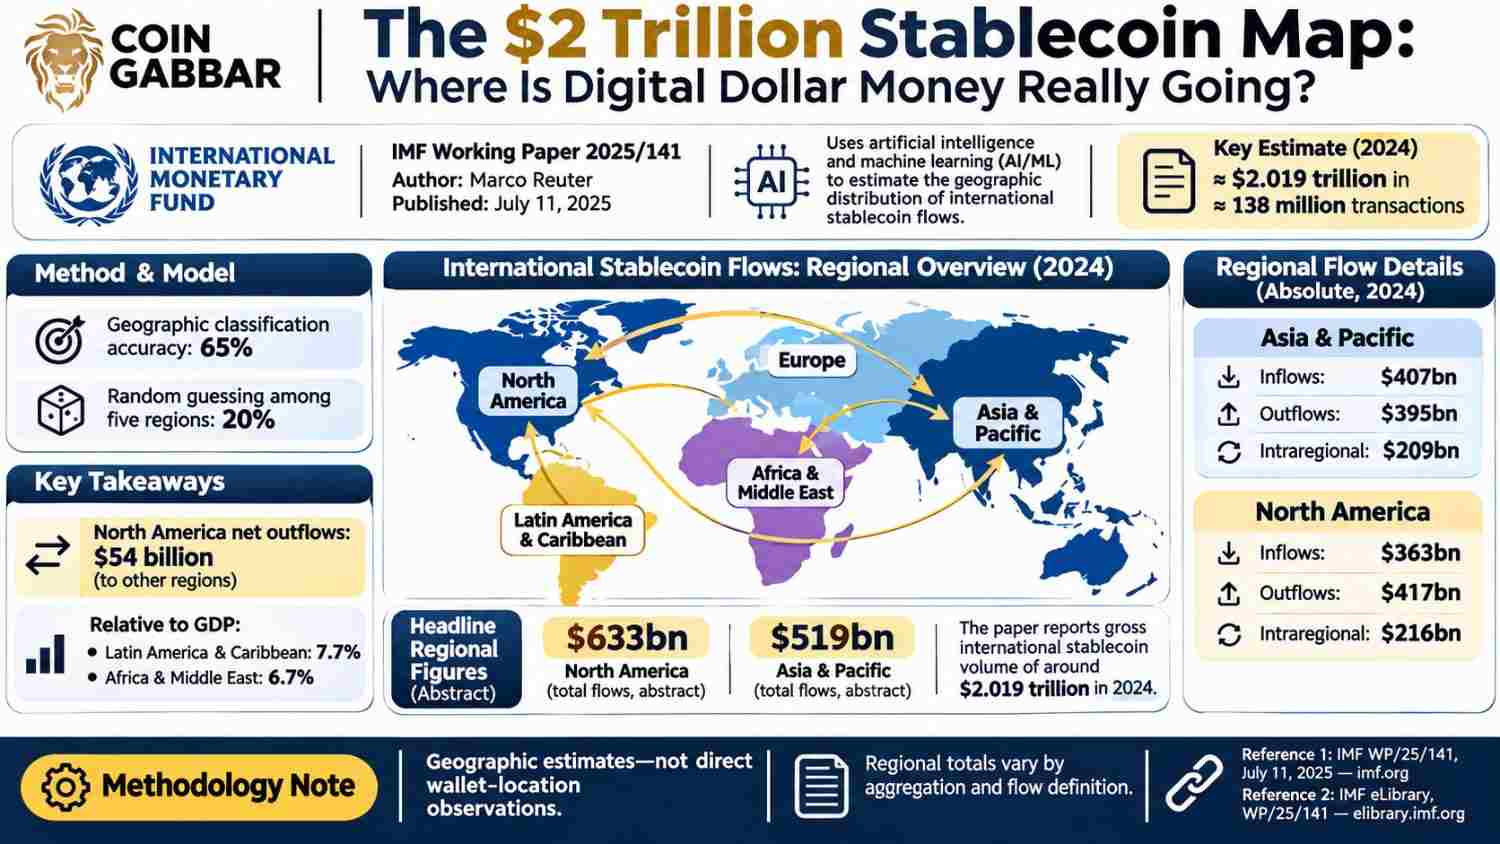
IMF, 2024: North America sent $633 billion, and Asia and the Pacific $519 billion.
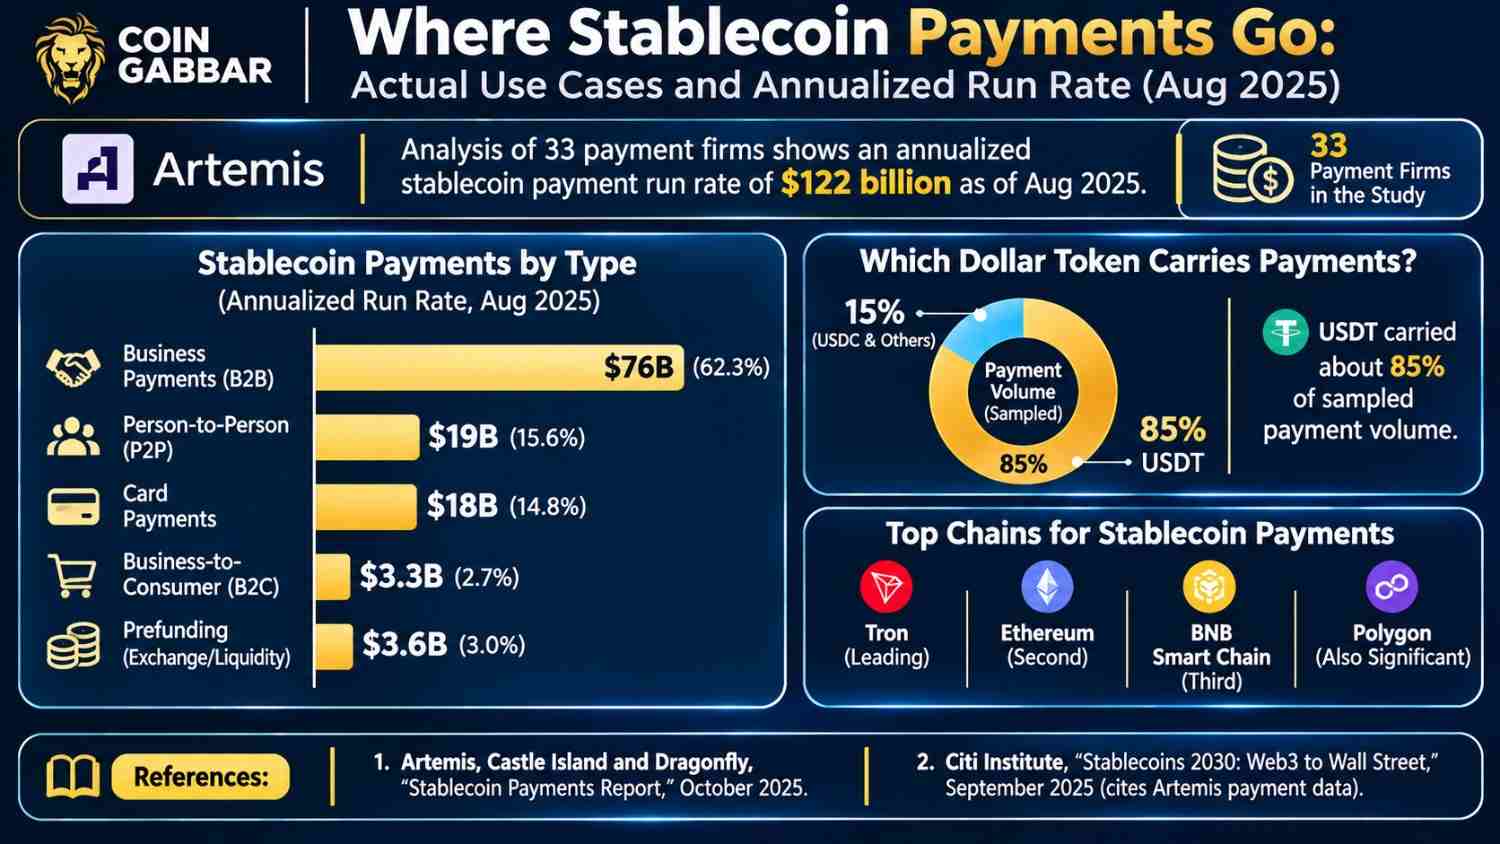
Artemis, August 2025: business payments lead at $76 billion a year.
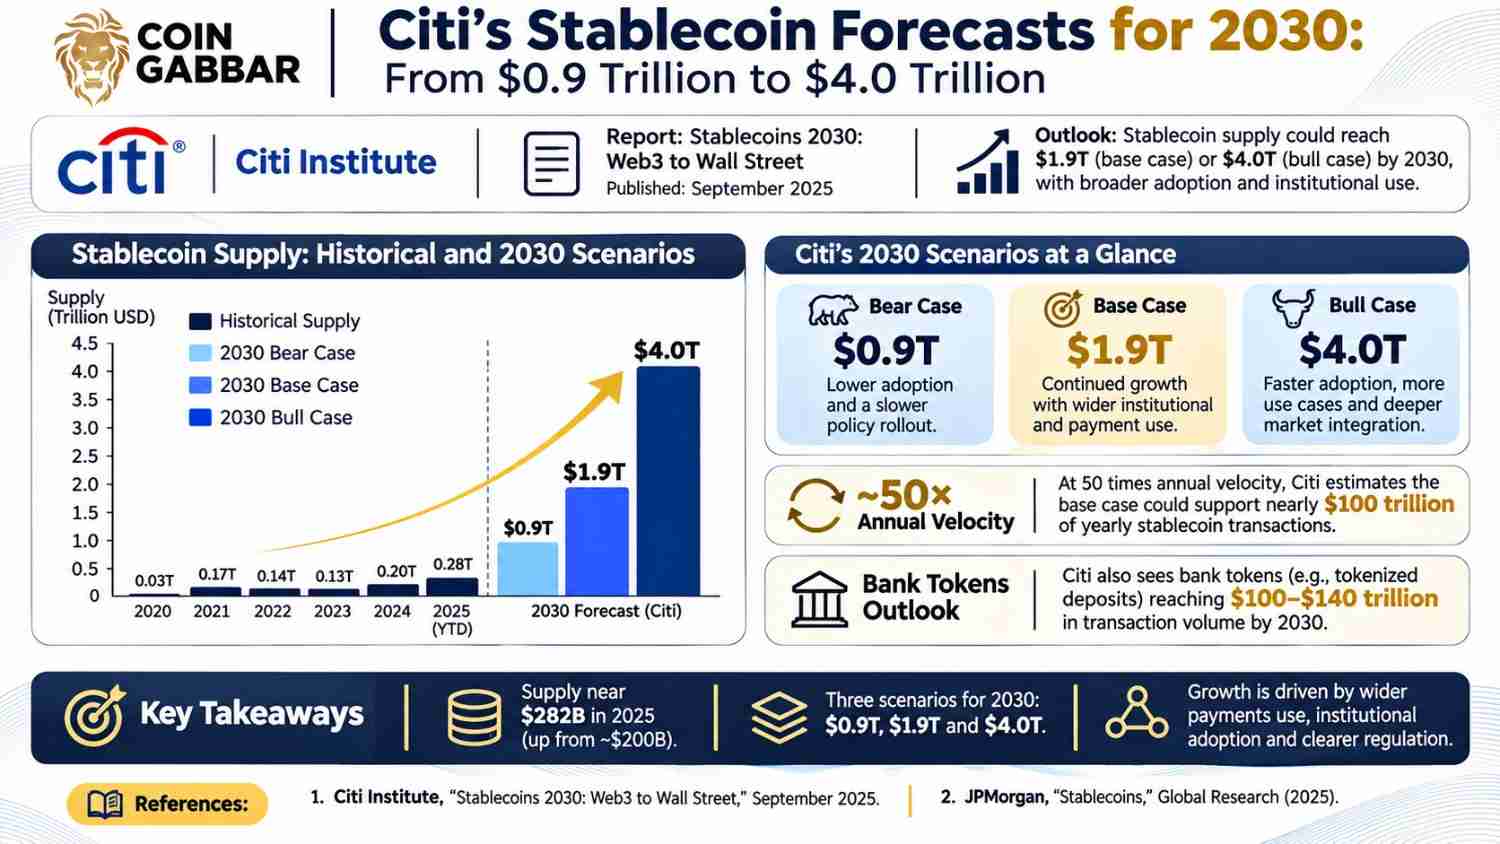
Citi, September 2025:supply near $282 billion, with a base case of $1.9 trillion by 2030.
Artemis, 2025: USDT carried about 85% of sampled payment volume.
How Big Are Stablecoin Flows Depending on What You Count?
The four numbers measure different things. The IMF estimates the cross-border transfers it can map. Artemis, in data cited by Citi, puts adjusted volume at $18.4 trillion in 2024, up 140% from $7.6 trillion in 2023.
Artemis also reports about $26 trillion a year of adjusted on-chain settlement. That is mostly trading, exchange, and automated activity. Known payments are a thin layer on top.
By division, $122 billion is about 0.47% of $26 trillion. Different scopes explain the gap, not an error.
Where Does the IMF Say Digital Dollar Money Goes?
AnIMF working paper by Marco Reuter, published in July 2025, uses machine learning to map them. It covers about $2 trillion in 2024.
North America accounted for $633 billion, and Asia and the Pacific for $519 billion. Relative to GDP, transfers were 7.7% in Latin America and the Caribbean and 6.7% in Africa and the Middle East.
North America showed net outflows. The paper links them to global demand for dollars, rising when the dollar strengthens. The 2023 banking crisis cut transfers that began in North America.
Which Dollar Tokens and Chains Carry Real Payments?
The Artemis payments report, published in October 2025, studied 33 payment firms. Their annualized run rate was $122 billion in August 2025.
Business payments led at $76 billion. Person-to-person transfers ran at $19 billion, card payments at $18 billion, and business-to-consumer at $3.3 billion. Prefunding added $3.6 billion.
USDT carried about 85% of sampled volume. Tron led by chains, then Ethereum, BNB Smart Chain, and Polygon. In Argentina, USDC reached nearly half. In the United States, it was close to a quarter. Our USDT versus USDC guide compares them.
What Do Citi’s Forecasts Say About Flows by 2030?
The Citi Institute report, dated September 2025, puts supply near $282 billion. That is up from about $200 billion at the start of 2025.
For 2030, it models three scenarios. The bear case is $0.9 trillion, the base case $1.9 trillion, and the bull case $4.0 trillion. At 50 times annual velocity, the base case supports almost $100 trillion of yearly transactions.
Citi also sees bank tokens reaching $100 to $140 trillion in volume. These are scenarios, not forecasts of price or return.
How Does the GENIUS Act Change Stablecoin Flows?
The GENIUS Act became United States law in July 2025, according toJ.P. Morgan research. It creates state and federal routes for approved issuers.
Issuers must hold one-to-one reserves in dollars, short-term Treasuries, and other high-quality assets. Issuers cannot pay yield. Access to the Federal Reserve for non-banks stays unclear.
J.P. Morgan’s Teresa Ho said the act “could further accelerate stablecoin adoption.”
What Limits and Risks Apply to Stablecoin Flow Data?
Numbers on stablecoin flows are estimates, not investment signals. They come from different years, scopes, and methods, so they should not be added together.
Artemis notes that some volume may be double counted. The IMF uses a model. Citi’s 2030 figures are scenarios. J.P. Morgan lists a smaller market, near $225 billion, than Citi, so dates and definitions matter.
Run risk also remains. The 2022 TerraUSD collapse showed how quickly redemptions can spread. Rules differ by country, so check local law.
What Do Key Stablecoin Measurements Terms Mean?
Nominal volume:every transfer counted, including bots and internal moves.
Adjusted volume:transfers after removing known noise.
Velocity: how many times the supply turns over in a year.
Net flow: money entering a region minus money leaving it.
Deposit token: a bank deposit recorded on a blockchain.
Run rate: a recent month scaled to a full year.
Expert Opinion: Are Stablecoins Becoming Payments or Trading Rails?
CoinGabbar analysis suggests stablecoin flows are still mostly trading and treasury activity, while payments grow from a small base. This is an editorial reading, based on comparing the scope, period, and adjustment of the IMF, Artemis, and Citi data.
The implication for dashboard readers is practical. A big volume figure shows activity, not adoption. Payment run rates and regional data say more about real use. This view is not a forecast.
Disclaimer: This article is for information only and is not financial, legal, or tax advice. Returns are never promised or assured. Digital assets are volatile, stablecoins can lose their peg, and rules differ by country, so all money put in can be lost. Readers should consult a qualified adviser.