The XLM price is sending mixed signals right now. Stellar is posting huge growth in one of crypto’s fastest-growing sectors, real-world assets, but at the same time, money continues flowing o
The XLM price is sending mixed signals right now. Stellar is posting huge growth in one of crypto’s fastest-growing sectors, real-world assets, but at the same time, money continues flowing out of its DeFi ecosystem.
Data from ALLINCRYPTO, citing Messari, shows Stellar’s 30-day real-world asset transfer volume hit $313 billion. That’s an insane 81,000% jump in just one month. Numbers like that make you stop and wonder. Is Stellar becoming a much bigger force in the tokenization game?
At the same time, BSCN pointed out that Stellar’s total value locked has been moving in the opposite direction. TVL fell from more than $247 million on August 26 to about $98 million a day later and has since dropped further to roughly $82.8 million. So, the big question is simple: which trend matters more for the XLM price?
Stellar’s RWA Growth Is Hard to Ignore
The strongest argument for the XLM price comes from what’s happening in the real-world asset market. Messari data shared by ALLINCRYPTO shows Stellar processed $313 billion in RWA transfer volume over the past 30 days.
An increase of nearly 81,000% in a month is difficult to overlook, especially when tokenized assets are becoming one of the biggest themes across the crypto industry. Stellar has always focused heavily on payments and asset transfers, so growth in tokenized assets fits directly into its core use case.
The latest numbers point to much more activity moving across the network, which is exactly what investors want to see when evaluating long-term adoption. If this trend continues, Stellar could strengthen its position among the leading blockchain networks competing for a share of the growing tokenized asset market.
But TVL Is Telling a Different Story
The challenge for the XLM price is that not every metric is moving in the right direction. BSCN reported that Stellar’s total value dropped from more than $247 million to $98 million in just 24 hours. The figure later slipped again to around $82.8 million.
TVL tracks the amount of capital deposited across DeFi protocols. When that number falls, it often means users are withdrawing liquidity or moving funds elsewhere. That creates an interesting contrast. Stellar’s transaction activity is rising rapidly, but DeFi participation is falling. Investors now have two very different data points to weigh when assessing the network’s health.
The XLM Price Is Starting to Show Signs of Life
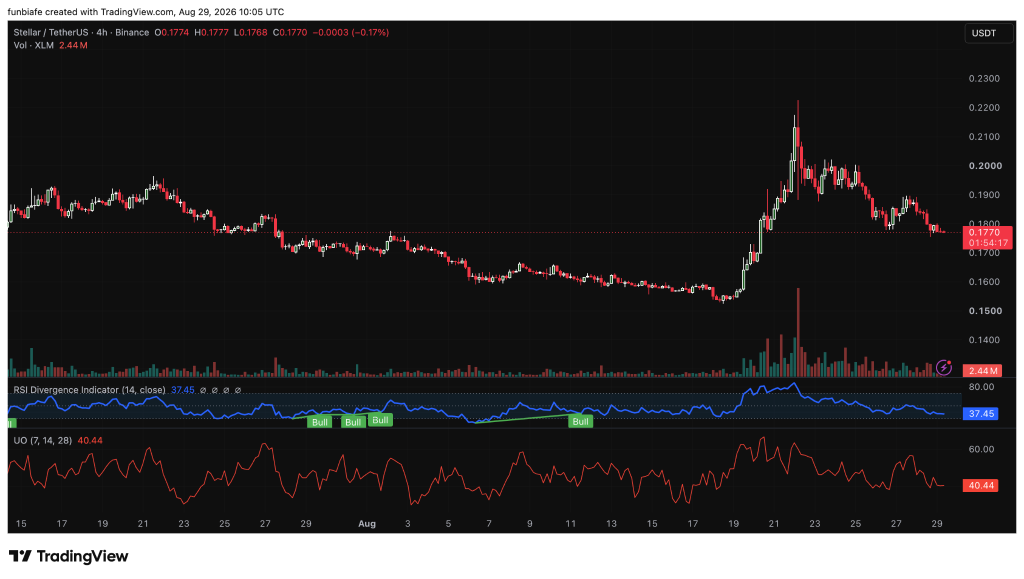
We had a look at the XLM chart and the token is trading near $0.177 after falling from a recent high close to $0.23. The technical setup is becoming more constructive. The RSI is at 37.45, putting the XLM price near oversold territory.
 Source: TradingView
More importantly, the indicator is flashing three bullish divergences. So even though price is still hanging near the bottom of its range, momentum is quietly getting better. The Ultimate Oscillator has also been creeping up and now sits at 40.44, which adds to the idea that selling pressure could be fading.
For buyers, the first hurdle is $0.18. Break that, and $0.19 comes into view, then the psychological $0.20 level, and $0.21 after that. Support is at $0.17, with deeper levels at $0.16 and $0.15 if things turn south.
Read Also: Gold Price Prediction for Today (August 29)
Where Could the XLM Price Go Next?
XLM still needs to prove itself before we can call it a full trend reversal, but the chart is starting to tilt in favor of the bulls. As long as it holds above $0.17, that bullish divergence setup stays valid. A move past $0.18 would be a big step and could open the door to $0.19 and then $0.20.
For now, Stellar finds itself in a unique position. Real-world asset activity is exploding, TVL is falling, and the XLM price is trying to carve out a bottom. Which of those trends wins out could determine where Stellar heads next.
FAQs
What are real-world assets (RWAs) on Stellar
Real-world assets are tokenized versions of traditional assets such as stocks, bonds, real estate, or other financial instruments. Stellar has become one of the blockchain networks facilitating the transfer and settlement of these assets on-chain.
Could Stellar’s RWA growth help drive the XLM price higherIt could. Strong growth in tokenized asset activity may attract more users, developers, and institutions to the network. If that growth continues and market sentiment improves, it could provide support for the XLM price.
Subscribe to our YouTube channel for daily crypto updates, market insights, and expert analysis.
The post Stellar Price Prediction: After $313 Billion in RWA Volume, XLM Faces Its Biggest Test Yet appeared first on CaptainAltcoin.


 STELLAR’S 30-DAY RWA TRANSFER VOLUME UP NEARLY 81,000% IN ONE MONTH.The transfer volume EXPLODED to $313B (