MSTR Stock Key Takeaways MSTR stock is up 27% in five sessions on Bitcoin's rally toward $79,000 Strategy's Bitcoin holdings show a $1.15 billion unrealized profit The company has not bought
MSTR Stock Key Takeaways
MSTR stock is up 27% in five sessions on Bitcoin's rally toward $79,000
Strategy's Bitcoin holdings show a $1.15 billion unrealized profit
The company has not bought new Bitcoin in seven weeks
$122 is the key resistance to watch, with $156 as a bigger medium-term target
STRC preferred stock trading near $95.95 is a signal to watch for renewed Bitcoin buying
A Bitcoin breakout above 80,000-83,000 could pave the way toward 90,000-100,000+, with MSTR stock potentially trading toward 500-700 if Bitcoin sets new highs
CGH stock shows a separate bullish weekly setup, with $150 as first confirmation and $666 as its primary long-term target
MSTR stock is having a strong week. Shares of Strategy Inc. (NASDAQ: MSTR) jumped to $120 on Friday morning as BTC pushed close to $80,000.
The move comes after a sharp five-day run. MSTR stock is now up 27% since August 17, riding a wave of bullish sentiment across crypto markets.
This rally has done more than lift the share price. It has also flipped Strategy's Bitcoin holdings back into the green.
How much Bitcoin profit does Strategy have now?
Strategy holds 849,447 BTC, bought at an average price of $75,653 per coin, according to Saylor Tracker data.
With $BTC trading around $77,080, that stash now sits on an unrealized profit of $1.15 billion.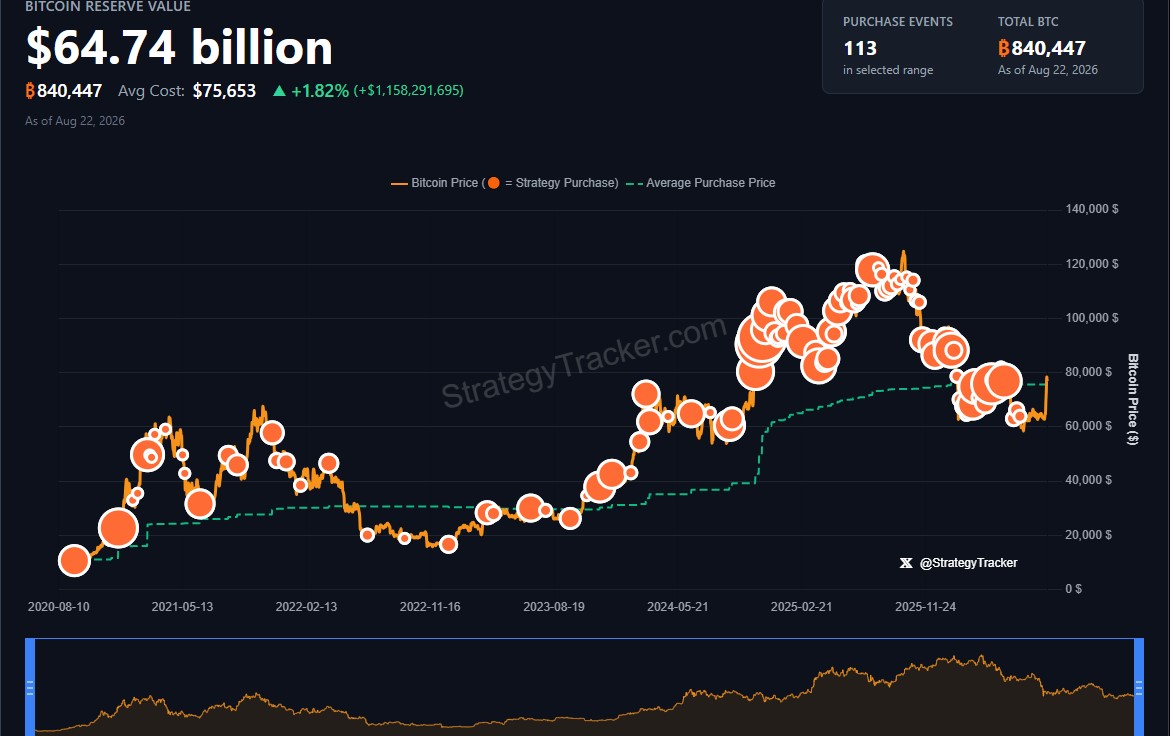
This is a big swing. Back in June, the same holdings were sitting on a $10 billion paper loss after BTC fell to $61,000.
What is driving the Bitcoin and MSTR stock rally?
The rally traces back to the Treasury's decision to raise long-dated bond buybacks from $2 billion to at least $4 billion per operation.
That move pushed yields and the dollar lower. Investors responded by buying Bitcoin and gold, a pattern often called the debasement trade.
Add to that a friendlier tone from the SEC and CFTC, a White House meeting with crypto executives, and roughly $1.61 billion in spot Bitcoin ETF inflows over four sessions, and the setup turned bullish fast.
The broader crypto market cap grew from $2.1 trillion on August 19 to $2.5 trillion. Bitcoin topped $79,000 for the first time since May 2026, overtaking Meta in market cap.
Other crypto-linked stocks joined the move too. Coinbase (COIN) gained 8.20% to close at $186.49, while Circle (CRCL) rose 5.16% to $87.98.
Analyst Samson Mow pointed out that short sellers betting against MSTR because of its earlier losses may now be forced to close their positions, which could push the stock even higher.
Does a Bitcoin profit mean Strategy is fully recovered?
Not quite. A paper gain is not the same as solving the company's underlying costs.
Strategy still carries financing obligations, and many shareholders who bought at higher prices are still underwater on MSTR stock.
A Monday filing showed the company raised $333.7 million by selling 3.46 million MSTR shares, but it bought no new $BTC for the seventh straight week. That cash went toward preferred share support and lifted its cash reserve to $4.8 billion.
Strategy's mNAV, a measure of its premium over Bitcoin holdings, is now near 1. That is a problem for Saylor's old playbook of selling pricey shares to buy more Bitcoin, since the premium that powered it has faded.
The STRC preferred stock, up 0.73% and trading at $95.95, is still about 4.5% below its $100 par value. Strategy CEO Phong Le has said STRC needs to reach $99 to $100 before the company resumes active Bitcoin buying.
What is the MSTR stock price prediction?
The daily chart shows MSTR breaking out of a long downtrend that ran from the $195-200 zone down into the $82-90 range, where it built a base.
Since July, the stock has consolidated between roughly $90 and $106. The recent push toward $119.25 broke above that range on strong momentum.
The next real test is the $122 area, which lines up with the 100-day EMA. A daily close above that level would confirm the breakout. RSI near 66 shows bulls in control without being overbought yet.
Scenario
Key Level
What It Signals
Immediate resistance
$122
100-day EMA, breakout confirmation
Upside targets
$130-135, then $145-150
Continuation of bullish trend
Major resistance
$156
200-day EMA, long-term trend shift
Extended targets
$170-180, $190-200
Retest of prior highs
First support
$106-110
50-day EMA, breakout retest zone
Bullish setup weakens
Below $100
Loss of near-term structure
Pattern invalidated
Below $90
Breakdown of accumulation base
If MSTR fails to hold above $122, a pullback toward the $106 support zone is possible. That would not necessarily break the bullish structure, but a drop under $100 would weaken it, and a move below $90 would call the whole pattern into question.
None of these levels guarantee a specific outcome. They mark zones traders are watching, not promises of where price will go.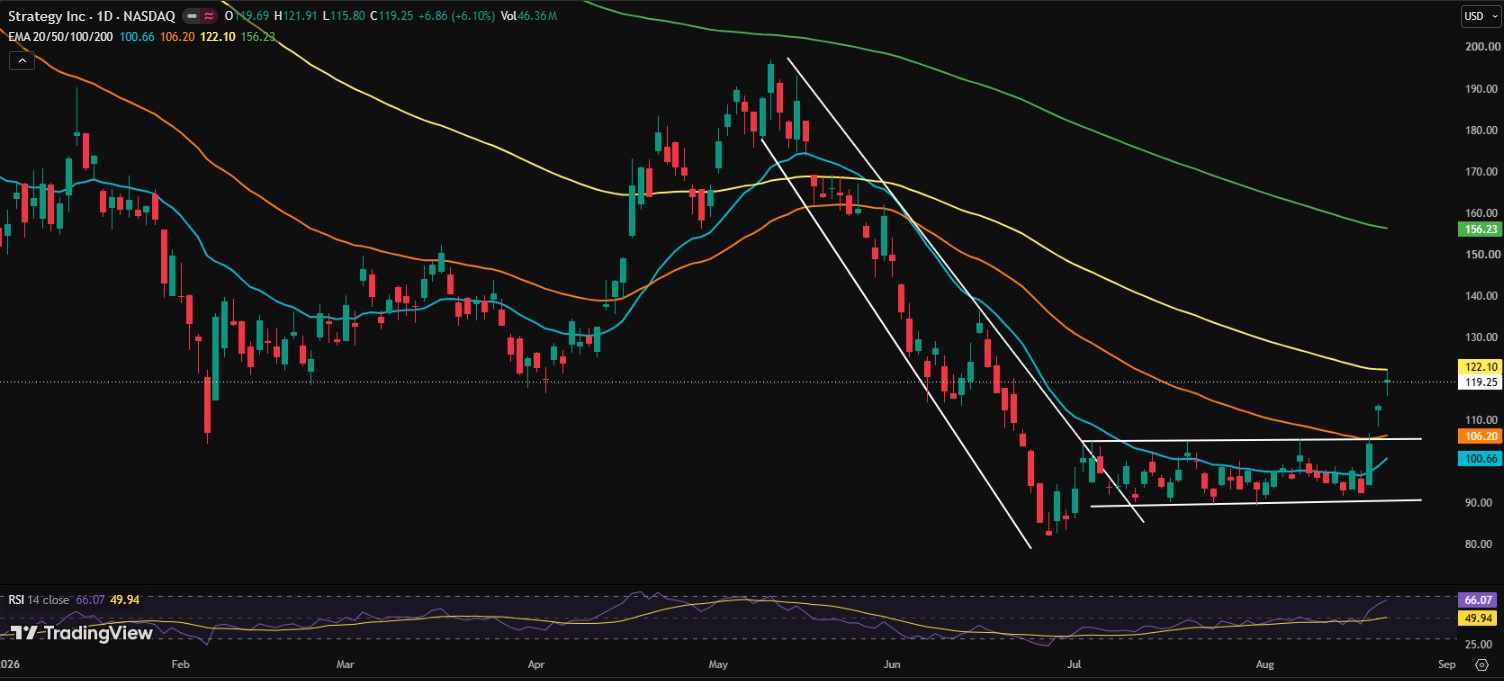
What happens to MSTR stock if Bitcoin breaks $80,000?
The world's largest cryptocurrency is trading close to $79,000, and traders are watching $80,000 as the next psychological line.
If the asset clears $80,000, the next big resistance sits near $83,000. This level also lines up with horizontal resistance on the chart.
A weekly close above $83,000 could open the door to a larger bullish move. Potential targets sit in the $90,000 to $95,000 range, with $100,000-plus becoming realistic if momentum holds.
For MSTR stock, this Bitcoin path matters a lot. Since Strategy's share price tends to move with Bitcoin's direction, a run toward $100,000 BTC or a new all-time high could pull MSTR stock toward the $500 to $700 zone over time.
This is a longer-term, higher-risk scenario, not a short-term target. It would likely need sustained buying, fresh ETF inflows, and Strategy resuming its Bitcoin purchases to play out.
MSTR stock technical analysis: what the weekly chart shows
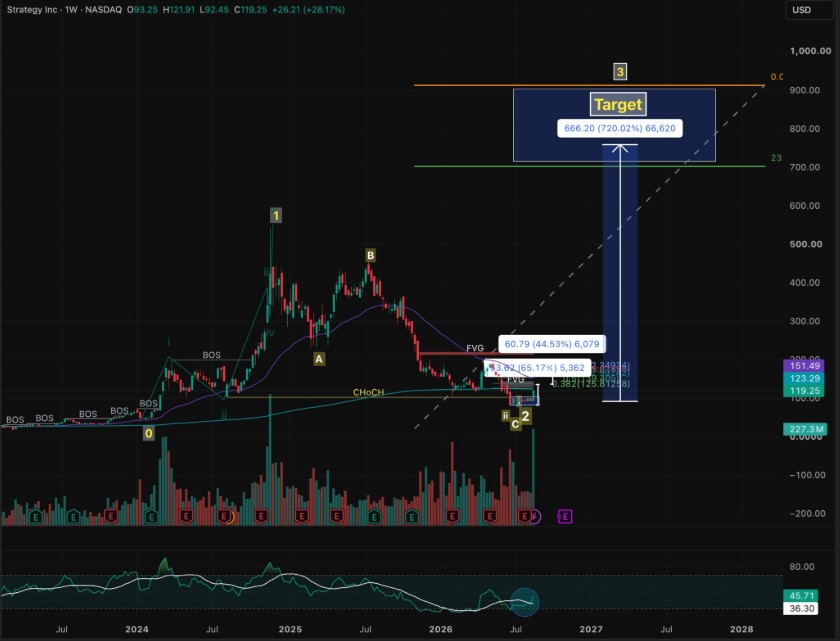
CGH is showing signs of a possible bullish reversal on its weekly chart.
The earlier price structure includes several Break of Structure (BOS) confirmations during the 2023-2024 accumulation and markup phase. That was followed by a strong impulsive move, marked as Wave 1, which pushed price toward the $400-500 area.
After that rally, CGH formed a corrective pattern, moving through Wave A and Wave B before declining into what looks like its current accumulation zone. That correction appears to have completed around the $110-120 region, where the stock is trying to build a new higher-low structure.
Change of Character (CHOCH) signal
The most important signal on the current chart is a Change of Character, or CHOCH, appearing around the $120-130 area. This suggests the prior bearish structure may be shifting into a bullish one.
Price is also interacting with marked Fair Value Gap (FVG) zones. The first sits around $130-150, with a larger supply zone near $340-360. CGH may need to reclaim these areas before the bigger bullish case is confirmed.
Wave 3 target and key levels
The current structure is labeled as the start of Wave 3, typically the strongest expansion phase in Elliott Wave analysis.
The first major confirmation level is around $150. A sustained weekly close above that could open the path toward $225-230, and then the $340-360 resistance zone.
If CGH breaks through those levels while printing higher highs and higher lows, the chart's primary long-term target comes into focus at roughly $666, close to a 720% move from the marked starting point.
Beyond that, the chart shows a further structural area near $700-720, with an extreme bullish extension around $900.
CGH Level
Meaning
$110-120
Key support, base of the current setup
$130-150
First breakout zone and FVG
$150
First major confirmation level
$225-230
Confirmation and resistance zone
$340-360
Major FVG and supply zone
$666
Primary Wave 3 target
$700-720
Major structural extension
$900
Extreme bullish target
This setup is high-risk and high-reward. The bullish case weakens considerably if CGH loses the $110-120 support zone or fails to hold the CHOCH structure.
Disclaimer: This article is for informational purposes only and does not constitute financial, investment, legal, or trading advice. Cryptocurrency and stock markets are highly volatile, and prices can move sharply in either direction. Always do your own research and consult a licensed financial advisor before making any investment decisions.