SUI Breaks Downtrend as Analysts Watch the $1.50 Price Level
SUI broke its nine-month downtrend after rising from $0.68-$0.70 to above $1, briefly reaching $1.08. Analysts identify $1.16, $1.42 and $1.50 as key upside levels, with $1.92 as a major macr
A
AnonymousCryptoCompass newsroom
September 23, 2026
2 min read
NEWS
CryptoCompass editorial visual for markets coverage.
SUI broke its nine-month downtrend after rising from $0.68-$0.70 to above $1, briefly reaching $1.08.
Analysts identify $1.16, $1.42 and $1.50 as key upside levels, with $1.92 as a major macro level.
RSI is above 70 while MACD momentum cools, putting $1.05-$1.08 resistance and $0.95-$0.90 support in focus.
SUI has broken a nine-month downtrend as analysts Ted Pillows and Scient track resistance levels above $1. Price climbed from the $0.68-$0.70 area to $1.0255, briefly reaching $1.08 before consolidating. The move followed a recovery through $0.80, $0.85, $0.90 and $0.95, while protocol updates added another focus for Pillows.
SUI Breaks Its Nine-Month Downtrend
Pillows said gasless stablecoin transfers now work at the protocol level. He also said confidential transfers are coming this month, keeping amounts private while settlement remains verifiable. Meanwhile, Pillows identified $1.16 and $1.42 as resistance zones from a technical perspective.
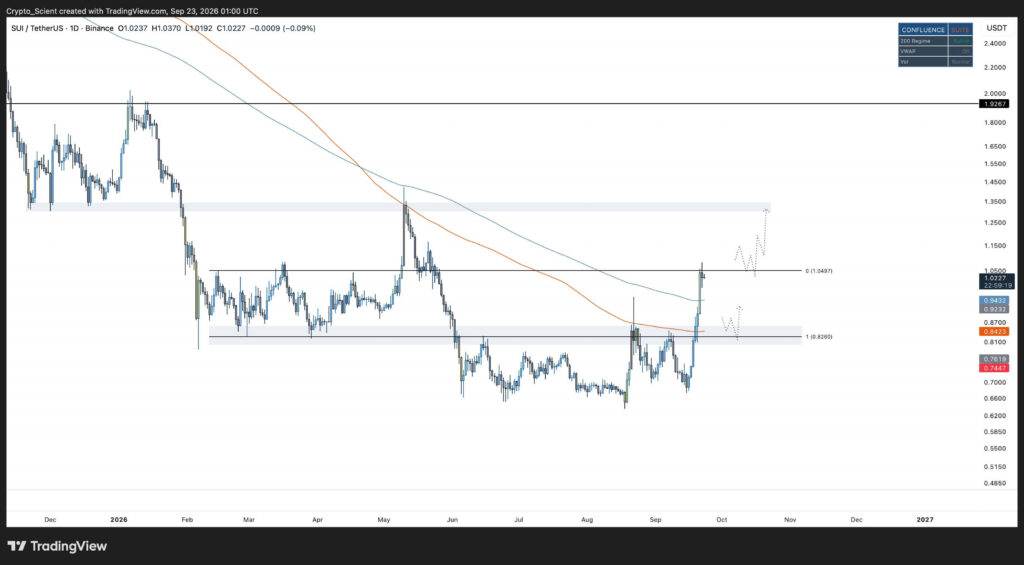
He said $1.50 is the next level he watches after the breakout. Scient described the chart structure as bullish across every timeframe through the weekly. On the daily chart, he said SUI swept lows around $0.64-$0.68 before reclaiming $0.80-$0.85.
Analysts Track SUI Resistance Levels
Scient said the price then moved toward the $1.05 region, where resistance emerged. He identified $1.41 and $1.92 as upside levels if SUI clears the recent highs. According to Scient, $1.92 represents the key macro support and resistance level on his chart.
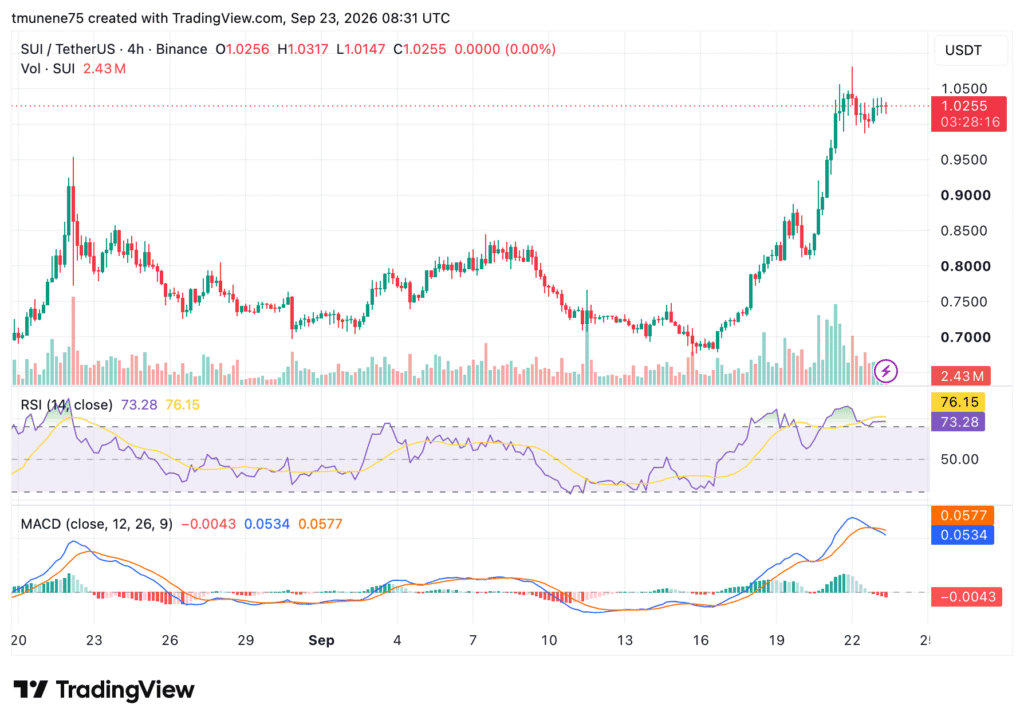
He also identified dips toward $0.85 as areas to build spot positions. The four-hour chart shows SUI consolidating around $1.02-$1.04 after reaching approximately $1.08. Price has established higher highs and higher lows during the recovery.
SUI Technical Levels
The chart places $1.00 as a psychological support level, followed by $0.95 and $0.90. Meanwhile, the $1.05-$1.08 zone remains the immediate resistance area. The RSI is at 73.28, with its moving average at 76.15.
That places RSI above the traditional 70 overbought threshold. However, the MACD remains bullish while momentum has started cooling. The MACD line is at 0.0534 against a 0.0577 signal line.
The histogram is at -0.0043. Recent volume expansion accompanied the breakout, while price remains near its latest highs. Pillows said some consolidation would be healthy before another move higher. A break above $1.08 could open higher levels, while a move below $1 could expose $0.95-$0.90.
Crypto markets have traded broadly higher over the past several days, with Bitcoin climbing above $86,000 this week and reaching its highest level in eight months. The cryptocurrency is up ab
Apeing Sale Advances to Round Five After Fast Early Rounds The latest Apeing crypto presale news confirms that the APEING meme coin offering has moved into round five, called "Dip Devourers,"


 Source:
  Source: