Key Takeaways: SUI down 18% weekly, broke 0.786 Fib at $0.927 and ascending trendline together. Price below all three SMAs: SMA50 at $1.005, SMA100 at $0.967, SMA200 at $1.218. Next support a
Key Takeaways:
- SUI down 18% weekly, broke 0.786 Fib at $0.927 and ascending trendline together.
- Price below all three SMAs: SMA50 at $1.005, SMA100 at $0.967, SMA200 at $1.218.
- Next support at $0.80-$0.82, the zone that launched the March-April rally to $1.40.
- 0.618 Fib at $1.030 is heavy resistance with liquidity stacked on both sides.
- Van de Poppe: free transactions, Hashi BTC yield, DeepBook, and USDSui are underpriced.
SUI is trading at $0.905 today, down 2% on the day and approximately 18% on the week. The move lower hasn’t been a single sharp selloff. It’s been a steady erosion that has now broken two things at the same time that were previously holding price up.
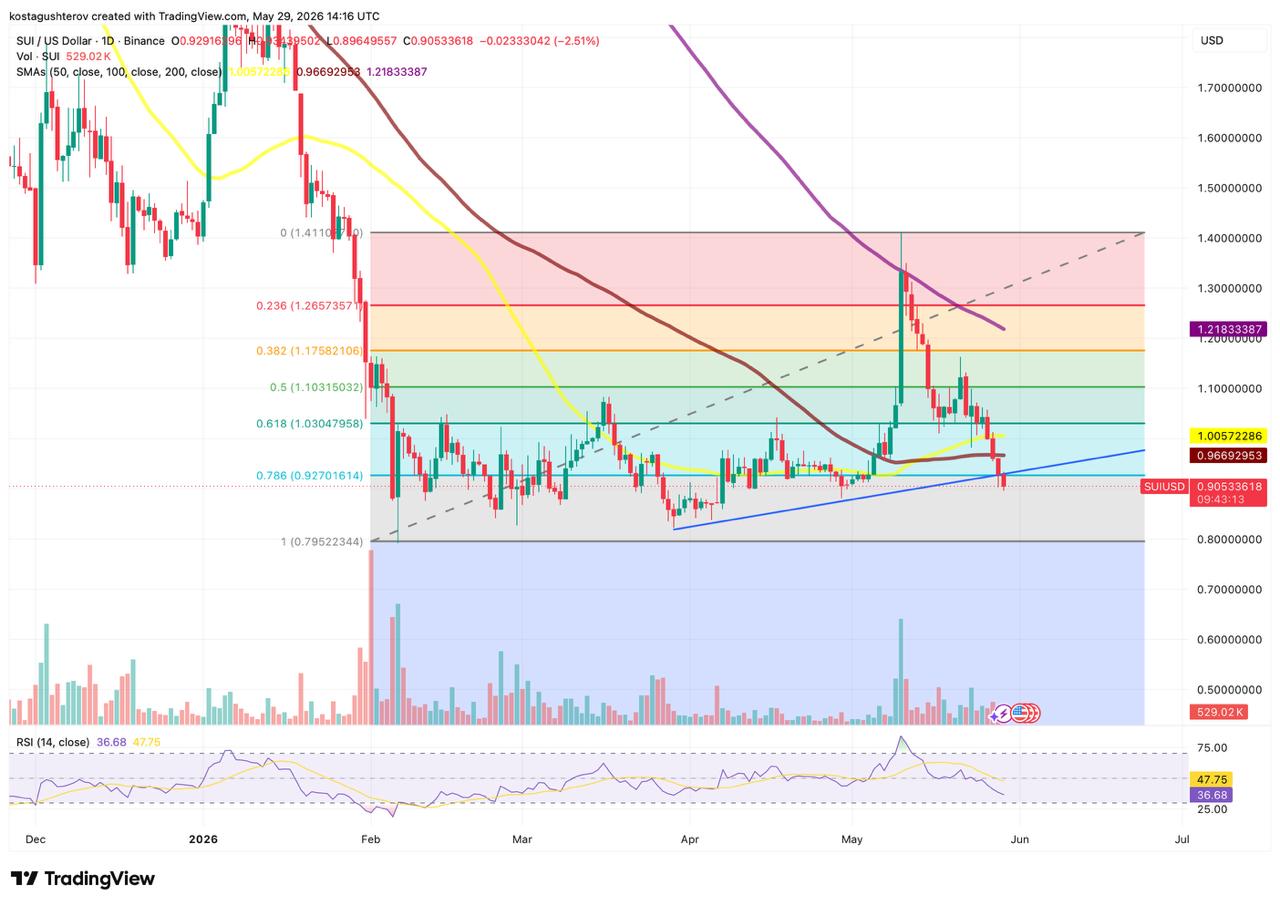
The 0.786 Fibonacci retracement at $0.927 was the last meaningful Fibonacci support above the full retracement. Price had been finding buyers there for several weeks. That level appears to be lost for now. The daily candle closed below it and today’s price action suggests the break is holding rather than recovering from it.
At exactly the same level, the ascending trendline active since the end of March broke simultaneously. That trendline connected the March lows through the April consolidation and the May recovery attempts, a rising floor underneath price for two months. When price loses both a horizontal Fibonacci level and a rising trendline at the same point, the break carries more weight. Two independent structures were both marking the same price as important. Both appear to be lost for now.
SUI is also below all three moving averages. SMA50 at $1.005, SMA100 at $0.967, SMA200 at $1.218, all above current price, all declining. There is no rising moving average below price providing support from underneath. RSI at 36.68 sits well below its signal line at 47.75, confirming sustained bearish momentum rather than a temporary spike lower. RSI isn’t at oversold extremes yet, which means there’s still room to fall before momentum reaches the levels where buyers have historically shown up in previous cycles.
If selling continues, where price could find support
The next meaningful support sits around $0.80-$0.82. That’s where SUI was trading at the end of March and beginning of April, the exact base from which the rally to $1.40 launched. Price spent time consolidating there before the move higher, which means buyers showed up in that zone before. The full Fibonacci retracement at $0.795 adds another reference point just below. A move from current price to $0.80 would be an additional 11-12% decline from here.
What recovery actually requires
Before any meaningful recovery could happen, the 0.786 Fib at $0.927 needs to be reclaimed. Not just touched. Closed above and then successfully retested as support from above. That’s the minimum condition to suggest buyers might be back in control at this level.
After that, SMA100 at $0.967 and SMA50 at $1.005 are sitting in a tight $0.038 range above. Breaking through two declining moving averages in quick succession would need genuine buying conviction, not just a brief relief bounce.
The level that matters most for any real recovery is the 0.618 Fibonacci retracement at $1.030. Looking at the chart, that level has been the most contested zone in this entire price range. Price pushed through $1.030, came back down through it, rallied above it again, reversed below it, multiple times in the past week. Every time price approached that level from either direction, it created a reaction. That kind of repeated two-directional testing creates stacked liquidity on both sides. Stop losses from buyers who got stopped out below it sit just underneath. Stop losses from sellers who got squeezed above it sit just above. When price approaches $1.030 again from below, all that accumulated supply could hit at once, which is why even a recovery that gets back to the SMA50 area could struggle to push cleanly through the 0.618 without a significant volume catalyst.
READ MORE:
 Coinbase Got a Green Light for Federal Banking Charter – Here’s What That Actually Means
Van de Poppe’s case for accumulating at these levels
His argument isn’t based on the chart at all. It’s based on what’s being built on the network while the price falls, and he sees four specific things the market isn’t pricing in.
The first is Hashi, a product that lets Bitcoin holders earn yield on their BTC through the Sui ecosystem. Nobody wants idle Bitcoin sitting without generating a return, and Hashi solves that without requiring BTC to be sold.
The second is DeepBook, Sui’s native liquidity infrastructure that lets anyone build essentially any financial market on-chain. Options, leverage, prediction markets, all buildable on the same base layer. That positions Sui as infrastructure for financial products rather than just a trading venue.
The third is what Van de Poppe considers most important: free transactions. Sui lets anyone send transactions at zero cost. His specific thesis here is about AI agents, autonomous software systems that are always optimizing for the cheapest, fastest, most reliable settlement layer. A chain where transactions are free, fast, and secure is where AI agents would naturally concentrate their activity as that category grows. “If they can find a spot where transactions are secure, fast and free, they’ll go to that place, and that’s what SUI is offering,” he wrote.
The fourth is USDSui, the native stablecoin that went fully live recently, enabling those free transactions to carry real economic value. Van de Poppe acknowledges the launch being live now means the actual upside is yet to come as the ecosystem grows into it.
He’s clear that none of these catalysts produce immediate price impact. Ecosystem growth takes time. But his point is that at $0.90, the market isn’t pricing in any of it.
The tension that defines the current setup
The chart and the fundamental thesis are pointing in opposite directions. Technically, SUI broke two key supports simultaneously and is below three declining moving averages with room for RSI to fall further. The next real floor could be 11-12% lower.
Fundamentally, one of the more credible altcoin analysts is calling it his anchor position while the market prints new lows.
Both things can be true at once. A fundamentally strong asset can keep falling in a risk-off environment where macro pressure keeps mounting and institutional outflows are running. The question isn’t whether Sui’s ecosystem developments are real. They are. The question is whether the market prices them in before or after the $0.80-$0.82 support zone is reached.
The information provided in this article is for educational purposes only and does not constitute financial, investment, or trading advice. Coindoo.com does not endorse or recommend any specific investment strategy or cryptocurrency. Always conduct your own research and consult with a licensed financial advisor before making any investment decisions.
The post SUI Lost Key Support and Is Down 18%: What Can Come Next appeared first on Coindoo.