SUI faces resistance between $1.17 and $1.27, while the chart maintains a potential B-wave structure. Derivatives activity increased during September, with liquidations rising alongside SUI's
- SUI faces resistance between $1.17 and $1.27, while the chart maintains a potential B-wave structure.
- Derivatives activity increased during September, with liquidations rising alongside SUI's move toward the $1.20 area.
- Binance leads SUI futures volume, while open interest remains distributed across Gate, Binance, MEXC, Bybit, and Hyperliquid.
SUI market outlook centers on a corrective structure, firm resistance, rising derivatives activity, and several retracement levels below.
SUI Faces Resistance During B-Wave Rebound
SUI is trading near $1.12 after recently reaching the $1.20 area. The chart shows a potential B-wave rebound within a broader correction. Resistance between $1.17 and $1.27 remains the central technical barrier.
More Crypto Online described the move as a B-wave bounce. The analysis also identified the 1.17-1.27 zone as active resistance. Price has since remained below that highlighted area on the chart.

Source:
X
The displayed structure follows an earlier advance toward approximately $1.30. That move is marked as wave three within the larger structure. The result was a downward move that formed the corrective A-B-C pattern exhibited below.
There are a number of Fibonacci levels grouped within the resistance zone. The chart marks retracement levels around 61.8%, 78.6%, and 88.7%. Their concentration places several technical levels close together above price.
Corrective Levels Define the Lower Price Structure
The chart identifies $1.1045 as the 23.6% retracement level. A deeper retracement near $1.00 marks the 38.2% level. The 50% retracement appears around $0.9294 on the displayed structure.
These levels sit inside the orange corrective area below resistance. The chart associates that lower region with a potential wave C. Therefore, the displayed correction remains structured beneath the resistance band.
The larger Elliott-wave labeling also shows a potential wave two. That structure sits beneath the current corrective sequence on the chart. Higher levels remain marked for the potential continuation of wave one.

Meanwhile, the latest price data places SUI around $1.12. The token has declined 4.63% over the past 24 hours. However, it remains 4.97% higher across the past seven days.
The recent movement also coincided with increased derivatives activity. Liquidations expanded as price accelerated through the $0.90 and $1.00 areas. That activity became more pronounced during the September advance.
Futures Activity Expands Across Major Exchanges
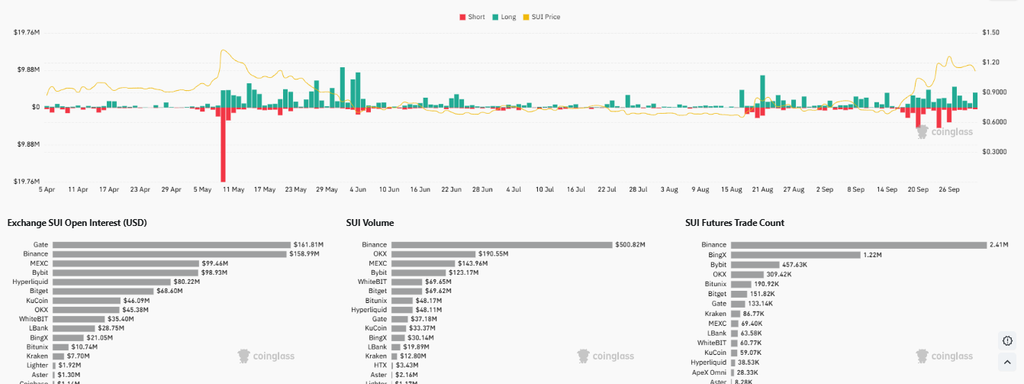
The liquidation chart shows several distinct periods of elevated positioning. A major short-liquidation spike appeared around early May. Later activity remained comparatively restrained through much of July.
Source:
Coinglass
Liquidations increased again during August as price began recovering. September then produced larger liquidation bars on both sides. Long and short positions were both affected during the latest advance.
Open interest remains distributed across several futures exchanges. Gate records approximately $161.81 million in open interest. Binance follows with $158.99 million, while MEXC records $99.46 million.
Bybit holds approximately $98.93 million in the displayed open interest data. Hyperliquid follows with roughly $80.22 million in positioning. This distribution shows participation across multiple trading venues.
Futures volume remains concentrated more heavily around Binance. Binance records approximately $500.82 million in SUI futures volume. OKX follows with $190.55 million, while MEXC records $143.96 million.
The futures trade-count data shows a similar concentration. Binance records approximately 2.41 million trades in the displayed period. BingX follows with 1.22 million, while Bybit records about 457,630 trades.