TLDR: SUI trades at $0.9796, down 2.74% in 24 hours and 10.74% over seven days. Expert More Crypto Online identifies $0.929 as the next support within SUI’s descending wedge pattern. Analyst
TLDR:
- SUI trades at $0.9796, down 2.74% in 24 hours and 10.74% over seven days.
- Expert More Crypto Online identifies $0.929 as the next support within SUI’s descending wedge pattern.
- Analyst Giannis Andreou marks 0.85–0.86 as support, with $0.66 as the chart’s invalidation level.
- SUI must reclaim $1.04 and $1.34 before higher resistance levels enter focus.
Sui (SUI) is trading near $0.98 as selling pressure continues across the altcoin market. CoinGecko data puts SUI at $0.9796, down 2.74% over 24 hours and 10.74% over the week.
Technical analysts are watching support levels as the token continues to form lower lows.
More Crypto Online identifies $0.929 as the next critical support within a descending wedge pattern. Meanwhile, Giannis Andreou’s weekly analysis identifies $0.85 to $0.86 as another important downside zone.
The charts show SUI trading far below its previous highs above $5. However, any recovery must overcome several resistance levels before the broader bearish structure changes.
The immediate focus remains on whether buyers can defend support or selling pressure pushes prices lower.
SUI Price Analysis: Why $0.929 Matters
More Crypto Online’s analysis on X identifies $0.929 as the next support level for SUI.
The accompanying one-hour Coinbase chart places the 50% Fibonacci retracement at approximately $0.9294. SUI was trading near $0.9868 on that chart, leaving support below the observed price.
A descending wedge forms when price moves between downward-sloping trendlines that gradually converge. Traders monitor these patterns for potential breakouts, although the formation alone does not confirm a reversal. SUI’s continued lower lows suggest sellers remain in control of the current price structure.
The $0.929 level therefore represents a nearby technical area to watch. A sustained move below it could expose lower support, although the supplied analysis does not establish the next downside target. Conversely, a recovery would need buying pressure and resistance breaks to strengthen the bullish case.
CoinGecko’s figures reinforce the weakness visible on the charts. SUI’s 24-hour trading volume stands at $645,383,763, alongside its weekly decline of 10.74%.
Volume provides market activity context, but these figures alone cannot establish whether selling pressure is about to ease.
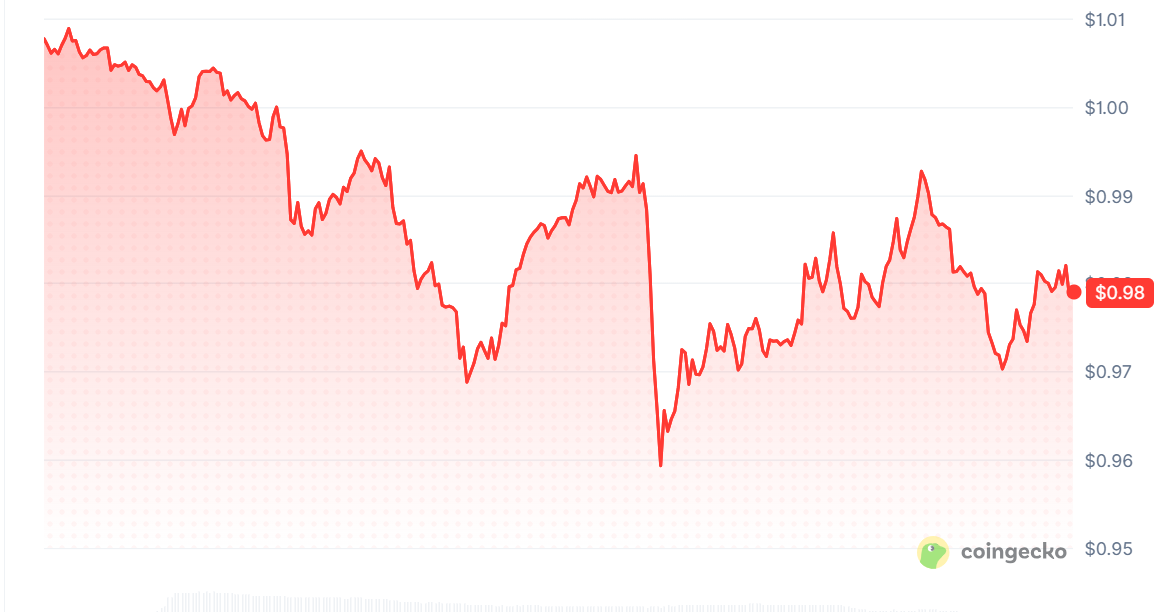
SUI price on
CoinGecko
SUI Price Analysis: Can Buyers Reclaim $1.04?
Giannis Andreou’s weekly chart identifies $1.04 as the first resistance level SUI needs to reclaim.
The latest weekly candle faced rejection near $1.14 before falling below that threshold. Resistance at $1.34 presents the next major hurdle for any sustained recovery.
On the downside, Andreou highlights $0.85 to $0.86 as an immediate support zone. A sustained weekly close below this region would weaken the recovery scenario and expose the marked $0.66 invalidation level. These levels represent chart-based scenarios rather than guaranteed price outcomes.
A stronger recovery would require SUI to reclaim $1.34 and establish support above it. The chart then identifies $1.80 and $2.35 as subsequent resistance levels.
A break above the descending trendline would provide additional evidence that the longer-term structure is improving.
Beyond $2.35, Andreou’s chart marks $3.92 as another resistance level, followed by previous highs above $5. However, these targets belong to a longer-term bullish scenario, not an established price trajectory.
The immediate distinction is between holding support and confirming a reversal. SUI must first navigate the $0.929 level highlighted by More Crypto Online and the lower $0.85 to $0.86 zone identified by Andreou.
Until resistance levels are reclaimed, the prevailing bearish structure remains intact.
SUI faces several technical hurdles despite the possibility of a recovery. Support near $0.929 is the immediate focus, while $1.04 and $1.34 are important upside levels to monitor.
The post Sui Price Analysis: $0.929 Support at Risk as SUI Drops 10% appeared first on Blockonomi.