SUI approaches $0.866, the 61.8% Fibonacci retracement that More Crypto Online identifies as the lowest ideal support for wave (4). Binance leads SUI futures volume at $172.84 million, while
- SUI approaches $0.866, the 61.8% Fibonacci retracement that More Crypto Online identifies as the lowest ideal support for wave (4).
- Binance leads SUI futures volume at $172.84 million, while Gate records nearly $116 million in open interest across the market.
- A break below $0.866 could weaken the proposed wave count, while a move above $0.935 would put the next resistance in view.
SUI price is nearing a closely watched Fibonacci level after weeks of losses, while futures data shows where traders remain active across major exchanges.
SUI Approaches the $0.866 Support Level
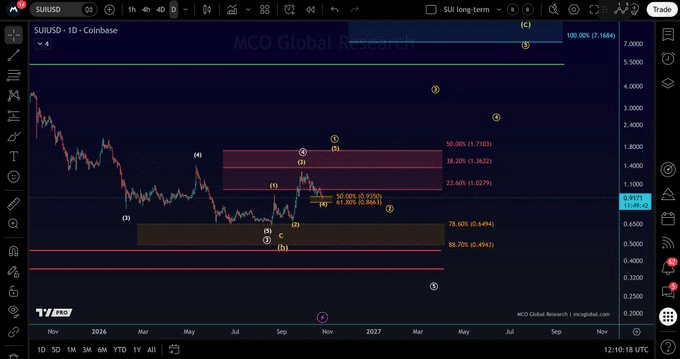
More Crypto Online says SUI is nearing the 61.8% Fibonacci retracement at $0.866. The analyst describes this as the lowest ideal support for wave (4). The recent rally of the token is being reversed, and the level is now important.
Source:
X
The daily chart indicates a downtrend since approximately $4 in late 2025. In the first months of 2026, SUI kept on declining and hit a lower trading range. The rally later pushed the token up to $1.70, but the buying was not sustained.
This marked the latest price at $0.9143 while the daily trading volume was close to $300.16 million. SUI gained 0.25% over 24 hours but lost 7.67% across seven days. The daily rise therefore came against a weaker weekly performance.
The 50% retracement sits near $0.935, above the $0.866 level. If the decline continues, the chart places further support near $0.694 and $0.494. Those lower levels would come into view if the current support fails.
Futures Data Shows Where Trading Concentrates
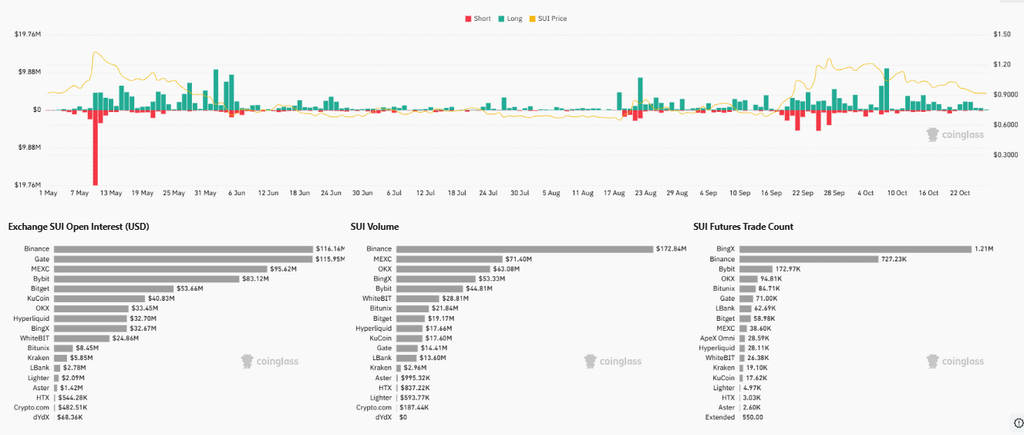
Binance recorded approximately $172.84 million in SUI futures volume, leading the listed exchanges. MEXC followed at $71.40 million, while OKX reached $63.08 million. Binance's reported volume was more than twice MEXC's figure.
Source:
Coinglass
Open interest showed a tighter contest between Binance and Gate. Binance held around $116.14 million, just above Gate's $115.95 million. MEXC followed with $95.62 million, while Bybit recorded $83.12 million.
Trade counts produced a different ranking across the same market. BingX led with approximately 1.21 million trades, followed by Binance at 727,230. Bybit ranked third, with roughly 172,970 trades during the displayed period.
The liquidation chart recorded sharp bursts during several volatile sessions. A large red bar appeared around May 12, indicating heavy long liquidations. Further bursts emerged in August and September as SUI moved more sharply.
Resistance Levels Depend on the Support Test
The proposed wave count treats the current decline as a possible wave (4) correction. Holding $0.866 would keep that interpretation within the chart's preferred range. A daily move below the level would require a fresh assessment of the count.
If buyers defend support, $0.935 becomes the first level to reclaim. The chart then marks resistance near $1.028, followed by $1.322. Each level would need to be crossed before the previous high near $1.70 returns to view.
The recent rally toward $1.70 remains the reference point for the pullback. SUI has surrendered part of that advance, and the price has yet to recover its former high. A sustained rebound would be needed to show that buyers have regained ground.
If $0.866 gives way, the next marked retracement sits around $0.694. The deeper level near $0.494 would become relevant if losses extend further. Neither figure guarantees that price will reach it.
For now, the support test and the futures figures offer two different views of SUI. The price chart sets out the levels that could shape the next move, while exchange data shows where trading is concentrated. Whether $0.866 holds will determine if the proposed wave (4) structure remains viable.