$SUI has spent more than a year sliding through a widening story of lower highs and lower lows, and this week's chart adds another chapter to that tale. The token is trading near $0.7357, dow
$SUI has spent more than a year sliding through a widening story of lower highs and lower lows, and this week's chart adds another chapter to that tale.
The token is trading near $0.7357, down close to 2.6% on the day, sitting right against the edge of a pattern that has quietly compressed for months.
For anyone following this SUI price prediction, the token now sits at the tip of a descending wedge, the kind of setup where a long downtrend either loses its grip or tightens once more before deciding its next move.
Derivatives Pulse: Traders Are Leaning Long Into the Squeeze
According to CoinGlass data, $SUI's open interest has climbed to $596.54M as of August 29, 2026, holding near the higher end of its recent range even as the price has cooled.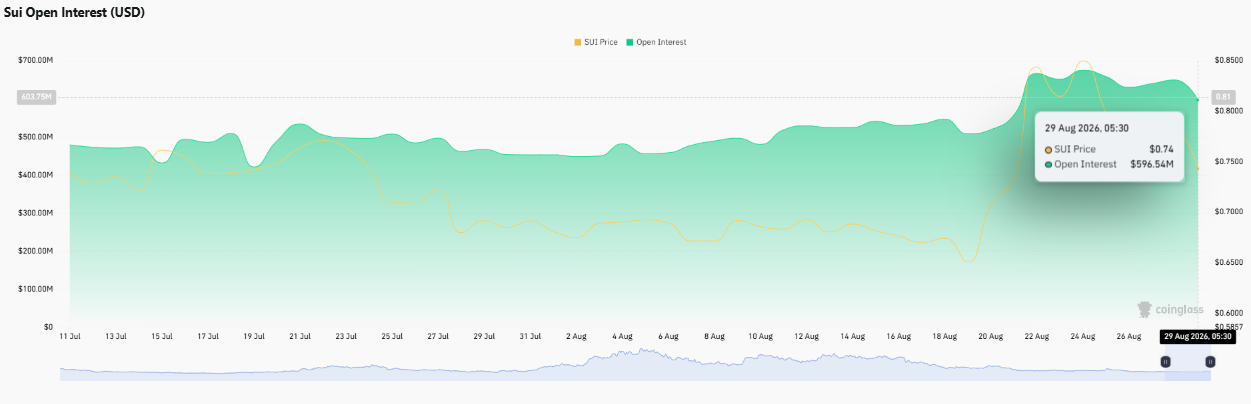
Long/short ratios echo that positioning: OKX shows a 3.1 ratio in favor of longs, while Binance's top trader accounts run at 2.8285.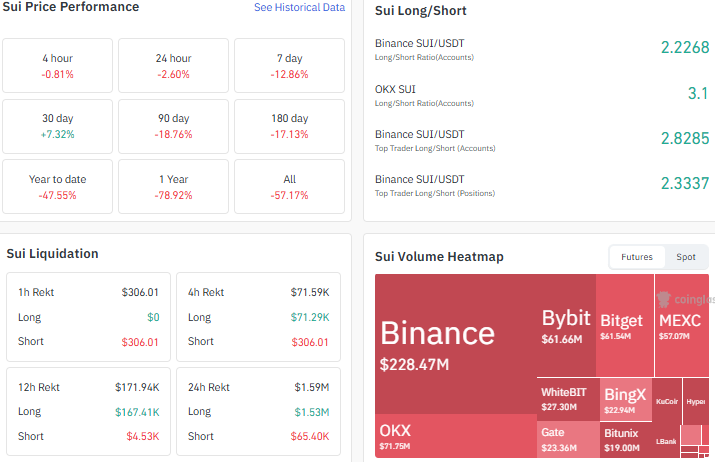
Liquidations tell a rougher story over 24 hours, with $1.59M wiped out, most of it, $1.53M, from long positions caught on the wrong side.
Binance dominates futures volume at $228.47M, trailed by OKX and Bybit near $71.75M and $61.66M.
On performance, $SUI is up 7.32% over 30 days but down 12.86% for the week and 18.76% over 90 days.
Capitalization and Network Stats
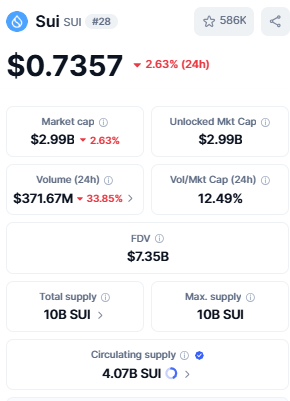
As per CoinMarketCap data, SUI carries a market cap near $3B against a circulating supply of 4.07B tokens out of a 10B total supply, with 24-hour volume at $371.67M.
On-chain data shows the network has processed close to 15.91B total transactions across more than 229 million accounts, with validators staking over 7B SUI at a yield near 1.48%, a backdrop that quietly supports this SUI price prediction.
Bull, Bear, and Neutral Signals for SUI
Signal
What It Shows
Bullish
Long/short ratio favoring longs across major exchanges; open interest climbing; 30-day return positive
Bearish
Price down close to 13% over the week; extended run of lower highs and lower lows
Neutral
RSI near 41, leaning toward oversold without confirming it outright
Technical Chart Read: SUI's Weekly Story
As per the TradingView chart, SUI has been carving a descending wedge on the weekly timeframe for well over a year, each rally falling short of the last as the price range keeps narrowing.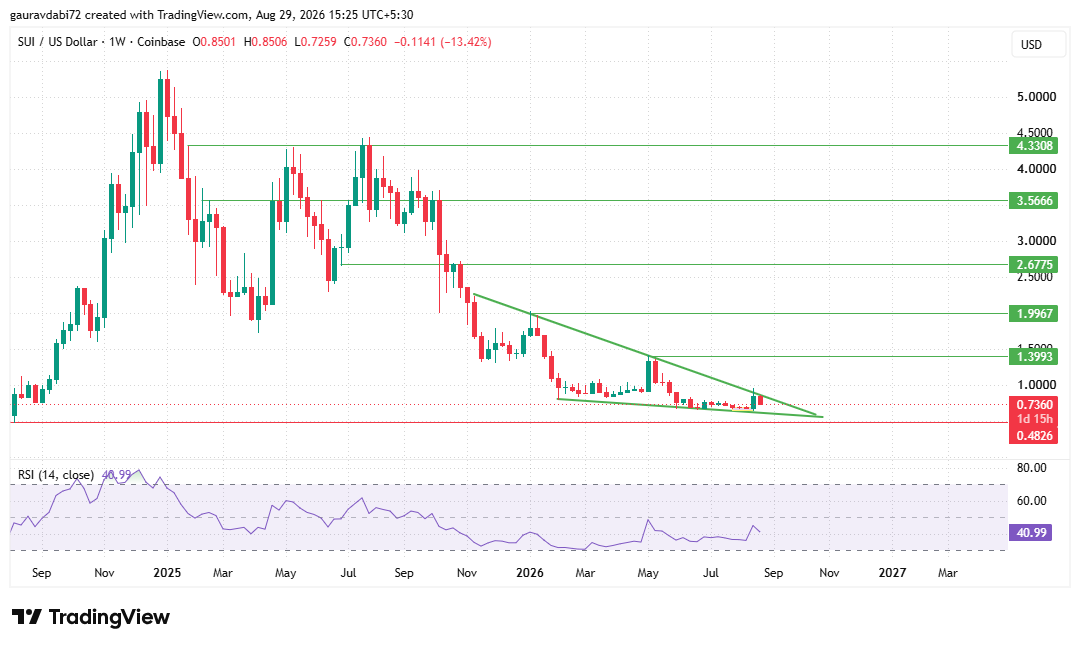
That wedge has pulled the token down toward $0.7360, just above a deeper support at $0.4826, the level where the structure would need to hold.
Should the wedge break upside instead, the next levels SUI can go toward stack up in order: $1.3993, $1.9967, $2.6775, $3.5666, and eventually $4.3308, levels that would reshape this SUI price prediction entirely.
The weekly RSI (14) reads 40.99, below the midpoint without yet dropping into deeply oversold territory, a sign the story still has room to swing either way.
Analyst Desk View
According to the CoinGabbar analyst desk, SUI's extended run of lower highs and lower lows has pushed the token into a genuinely compressed spot, and compression like this eventually resolves one way or the other for any SUI price prediction.
A hold above $0.4826 keeps the broader structure intact and leaves room for a pullback toward the wedge's upper boundary, while a slip below that level would reopen a very different chapter.
Either way, the coming weeks look set to answer a question this chart has been building toward for over a year.
Disclaimer: This article is for informational purposes only and should not be considered financial or investment advice. Cryptocurrency markets are highly volatile; readers are advised to do their own research before making any decisions.