Is SUI quietly building a base near $1, or is the market just catching its breath before a deeper slide? That's the question sitting under this SUI price prediction on Oct 22, 2026 at 08:19 U
Is SUI quietly building a base near $1, or is the market just catching its breath before a deeper slide?
That's the question sitting under this SUI price prediction on Oct 22, 2026 at 08:19 UTC, with the token trading near $0.9928 inside a descending channel that's kept sellers in charge since early October, and recentprice prediction coverage keeps tracking that setup.
And the selling isn’t random. Buyers who borrowed money to bet on a rise got forced to sell, traders are using less leverage, and every bounce keeps running out of steam below $1.05.
SUI Price Snapshot: Market Data at $0.9928
According toCoinGecko market data on Oct 22, 2026, at 08:19 UTC, the $SUI price sits at $0.9928, down 3.2% over 24 hours. The daily range ran from $0.992 to $1.06, so the price is sitting near the bottom of that range.
Metric
Value
SUI Price
$0.9928
24h Change
-3.2%
Market Cap
$4.087B
24h Trading Volume
$555.24M
Circulating Supply
4.118B
Total Supply
10B
Market Rank
29
Source: Data taken from CoinGecko
SUI Open Interest Falls From $1.1B to $750M 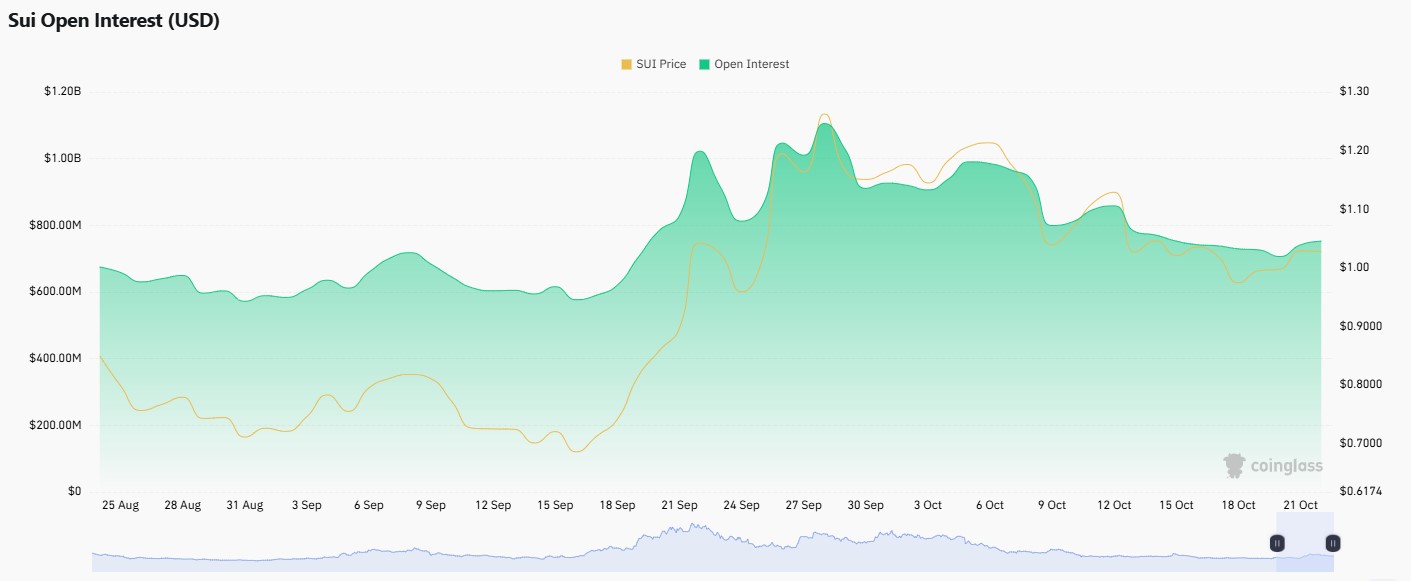
Source: Data taken from CoinGlass
On the CoinGlass chart, SUI open interest climbed from about $600M in mid-September 2026 to roughly $1.1B around Sep 28, 2026, when the price touched near $1.26. It's slid back to about $750M by Oct 21, 2026, and the price slid with it.
A rising price with rising open interest usually means fresh money is backing a move. Falling price with falling open interest means traders are stepping aside, and that's the pattern here.
So who's left to push the price higher?
SUI Liquidations Hit Longs for $813.76K in 24 hours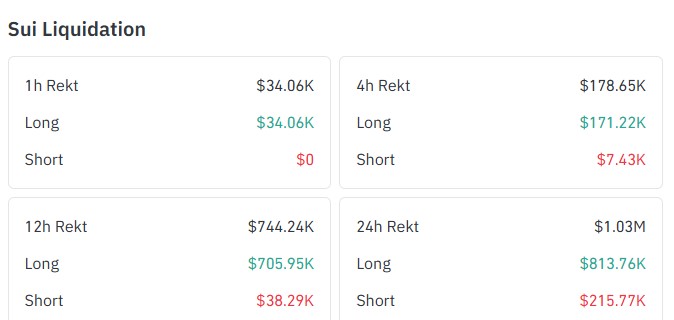
A liquidation happens when an exchange force-closes a leveraged trade because the margin ran out. CoinGlass liquidation data $1.03M wiped out over 24 hours.
Longs took $813.76K of that, close to 79%, and the latest hour hit only longs. SUI liquidations like these show dip buyers keep arriving early, and that's rarely a sign of strength.
SUI Exchange Volume: Binance Leads at $221.39M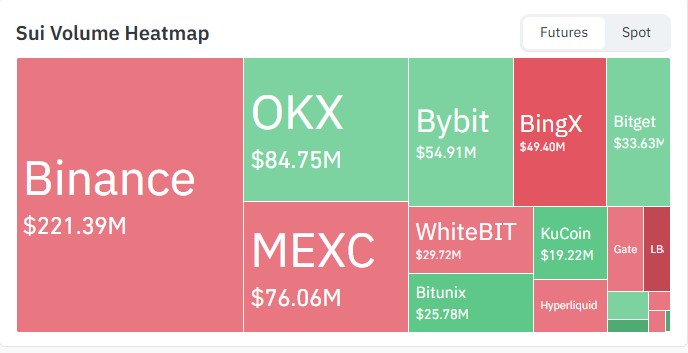
Source: Data taken from CoinGlass
Futures volume shows where the real action sits, and Binance leads at $221.39M on the heatmap, with anearlier volume surge now behind it.
OKX follows with $84.75M, then MEXC at $76.06M, Bybit at $54.91M, and BingX at $49.40M. Binance alone moves about 2.6 times the volume of OKX.
SUI Price Prediction: 4-Hour Chart Analysis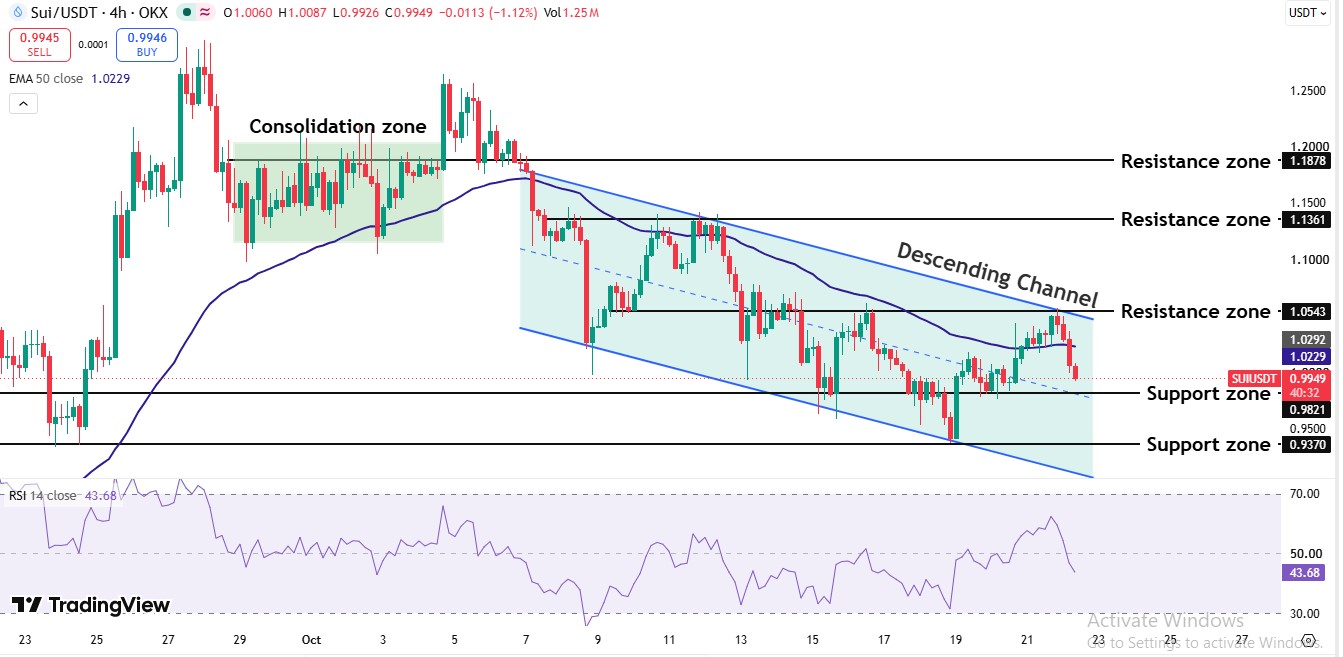
On the 4-hour chart, the price spent late September in a consolidation zone, a zone where buyers and sellers trade in a tight range. And then it spiked toward $1.26 in analtcoin breakout setup before sellers took over.
Since then, the price has moved inside a descending channel, which is a pair of parallel lines that keep guiding the price to lower highs and lower lows. A closer read makes the story clear: the upper edge near $1.0543 is the rejected price on Oct 21, 2026.
Each bounce inside the channel has topped out lower than the one before, and each dip has found a lower floor.
50 EMA Levels Explained
The 50 EMA, an exponential moving average sits at $1.0229, and the price is trading under it. That keeps the short-term trend tilted down.
RSI Levels Explained
RSI reads 43.68. Under 50 favors sellers, but it isn't below 30 yet, so there's no oversold signal to lean on.
SUI Support and Resistance Levels to Watch
These levels come from the 4-hour chart.
Zone
Level
Resistance 3
$1.1878
Resistance 2
$1.1361
Resistance 1
$1.0543
Support 1
$0.9821
Support 2
$0.9370
Nearest SUI support and resistance matters most here, since the $0.9821 floor sits barely under the current price.
SUI Price Prediction: Bullish, Base, and Bearish scenarios
A bounce to $1.05 seems possible. But on second thought, a bounce only counts if the price stays above the EMA, the average price line at $1.0229, and the scenarios below show why.
Case
Trigger
Target
Invalidation
Bull
Trades above $1.0229, then breaks $1.0543
$1.1361
Falls back under $1.0229
Base
Range between $0.9821 and $1.0543
Sideways chop
Breaks either edge
Bear
Trades below $0.9821
$0.9370
Reclaims $1.0543
since the price has spent days bouncing between $0.9821 and $1.0543. Sideways trading can drain patience long before it drains price.
This SUI price prediction stays bearish while the price holds under $1.0229.
SUI Price Forecast: Expert Outlook
As per Coingabbar analysis, the SUI price prediction is leaning bearish for now. The price is stuck in a falling channel, traders are using less leverage, and most of the forced sales hit buyers.
If price breaks above $1.0543 and stays there, the mood could flip fast, and morealtcoin price updates will show whether that happens. Until then, $0.9821 is the price level that decides what comes next.
A drop toward $0.9370 wouldn’t ruin the bigger picture, since price has bounced from near that area before. But if it falls below that level, the slide could go much further.
Disclaimer: This article is for informational purposes only and isn't financial advice. Crypto assets are highly volatile, and prices can move sharply in either direction, so readers should do their own research before making any decision.