Will buyers defend the $0.7659 support level this week, or is a slide toward the $0.7089 support level next? This Sui price prediction begins with SUI trading near the base of a falling chann
Will buyers defend the $0.7659 support level this week, or is a slide toward the $0.7089 support level next?
This Sui price prediction begins with SUI trading near the base of a falling channel after a failed push toward its early November high. Traders who tracked the earlierprivacy news bounce saw SUI rally, yet sellers took back control.
Sui Price Forecast: 24-Hour Market Snapshot
CoinGecko market data shows SUI down 3.7% over 24 hours, with the day's range running from $0.766 to $0.8266. Market cap sits at $3.197B, and FDV (fully diluted valuation, the price multiplied by max supply) reads $7.723B.
Metric
Value
Price
$0.7726
24h change
-3.7%
24h range
$0.766 to $0.8266
Market cap
$3.197B
Market cap rank
28th
FDV
$7.723B
24h volume
$313.584M
Circulating supply
4.139B SUI
Max supply
10B SUI
Source:CoinGecko market data, captured Nov 14, 2026, 9:48 UTC
SUI ranks 28th by market cap, and $313.584M of volume let sellers push price toward the bottom of the day's range. FDV at more than twice the market cap means 5.861B SUI still sits outside circulation, a possible supply pressure.
Sui Liquidation Data: $1.42M in Longs Wiped Out
Window
Total liquidations
Longs
Shorts
1h
$20.14K
$19.79K
$343.17
4h
$116.71K
$114.70K
$2.01K
12h
$1.32M
$1.30M
$21.97K
24h
$1.62M
$1.42M
$204.30K
Source: CoinGlass liquidation data, SUI 1h, 4h, 12h, and 24h windows, captured Nov 14, 2026, 9:48 UTC
Longs took the hit. CoinGlass liquidation data shows $1.62M wiped out in 24 hours, and $1.42M of it came from longs. A liquidation is a forced exit from a leveraged trade after margin runs out.
Over the last 12h, longs lost $1.30M against $21.97K for shorts.
Long liquidations add sell orders, because exchanges force-sell the positions. That adds pressure to this Sui price prediction while SUI sits near the $0.7659 support level.
Sui Open Interest and Futures Volume: $467.50M at Stake
Open interest is the total value of open futures contracts. CoinGlass data puts SUI futures open interest at $467.50M and 24-hour futures volume at $497.87M.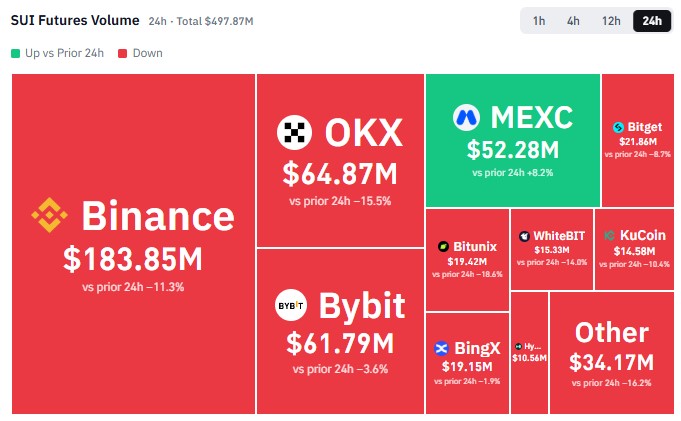
Source:CoinGlass SUI futures data, 24h heatmaps, captured Nov 14, 2026, 9:48 UTC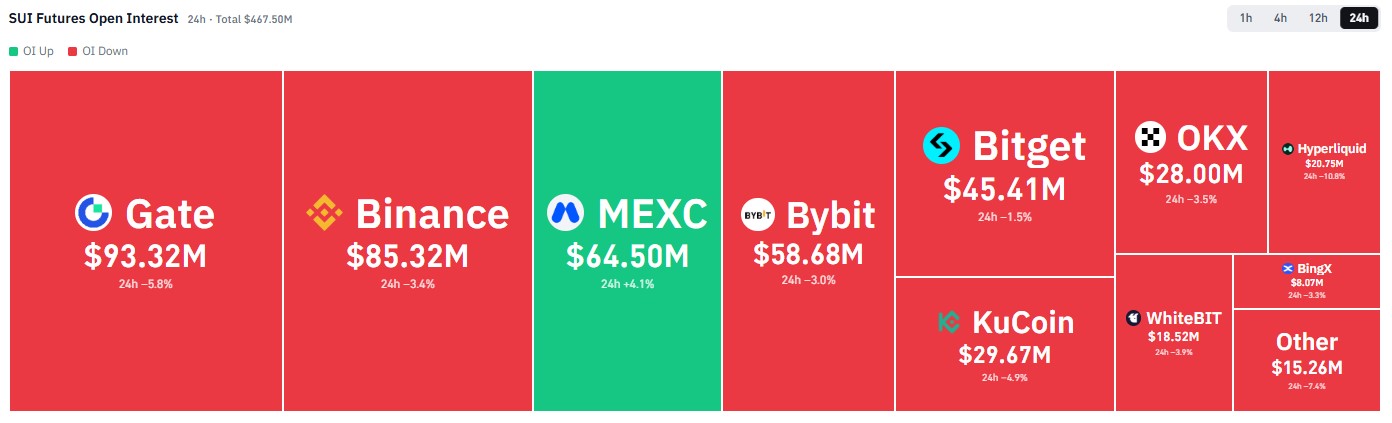
Source: CoinGlass, SUI futures open interest heatmap, 24h, captured Nov 14, 2026, 9:48 UTC
MEXC was the only venue where volume and open interest both rose, up 8.2% and 4.1%. Open interest fell on every other venue.
Falling open interest during a drop means traders are cutting positions, leaving less fuel for a rebound.
Sui Technical Analysis: 50 EMA and RSI Levels
The Binance 4H chart for SUI/USDT on TradingView frames this Sui price prediction. A fast November rally pushed SUI up to the $0.9532 resistance level before sellers took control.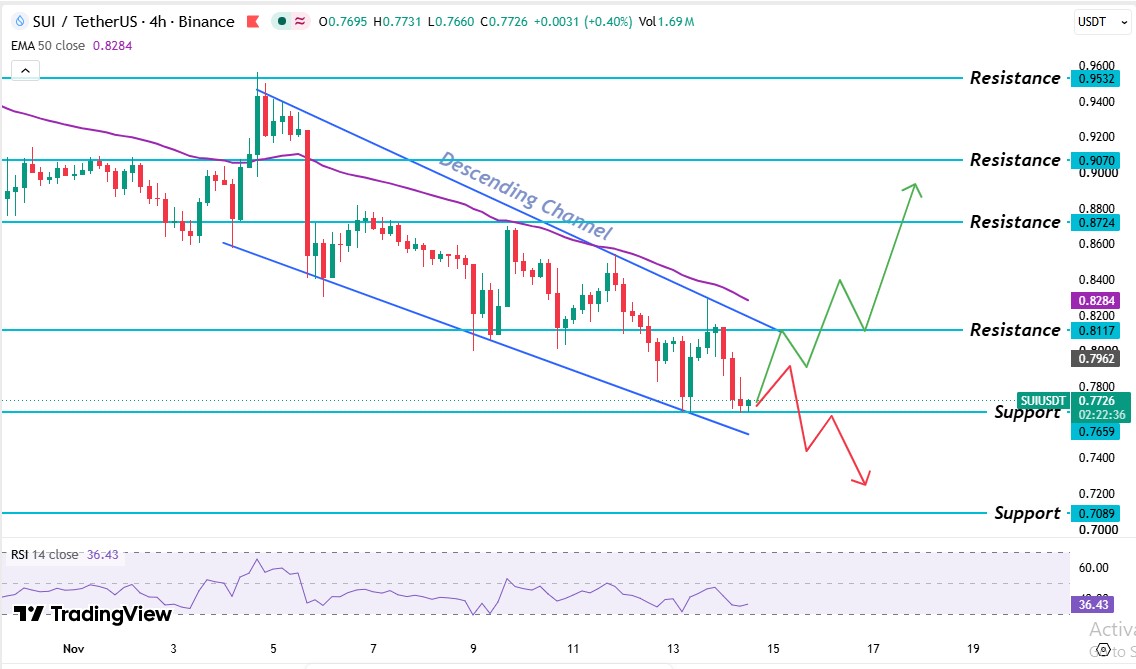
Source: TradingView, SUI/USDT, captured Nov 14, 2026, 9:48 UTC
SUI first moved sideways near $0.9070, then spiked into $0.9532 and got rejected. The drop sliced through $0.9070 and the 4H 50 EMA in one move. That level had held as support before the break, so it flipped into a resistance level.
A bounce stalled at the $0.8724 resistance level, and price then slid inside a descending channel, a pair of falling parallel lines guiding price lower. A break above the upper trendline signals a fading drop, and a break below the lower line opens room toward $0.7089.
Buyers tried at least three times to reclaim the $0.8284 EMA level, where sellers have defended and failed each time. The latest drop reached the $0.7659 support level, where buyers need to step in, andNovember support levels are back in focus.
Right now, SUI trades just above the $0.7659 support level, below the $0.8117 resistance level, and under the $0.8284 50 EMA level.
The SUI 50 EMA sits at $0.8284. SUI's $0.7726 price trades 6.8% below it, and the latest candle trades below the line too. The EMA is the cleanest bull trigger, so a recovery needs a candle trading above it and $0.8117.
The SUI RSI reads 36.43 on the 14-period setting, down from a peak above 60 in the early rally. Under 50, sellers hold the edge. Above 30, oversold conditions haven't formed, and the price has room to fall.
Sui Support and Resistance Levels
Level
Type
$0.9532
Resistance level
$0.9070
Resistance level
$0.8724
Resistance level
$0.8284
50 EMA
$0.8117
Resistance level
$0.7659
Support level
$0.7089
Support level
The nearest support level sits at $0.7659, and the nearest resistance level at $0.8117. Resistance levels cap rallies, and support levels catch drops.
Sui Price Forecast: Bull, Base, and Bear Scenarios
Scenario
Trigger
Target
Invalidation
Bull
Daily candle trades above $0.8117
$0.8724, then $0.9070
Falls back below $0.8117
Base
Price stays between $0.7659 and $0.8117
Sideways trade inside that range
Daily candle breaks either level.
Bear
Daily candle trades below $0.7659
$0.7089 support level
Daily candle trades above $0.8117
Regulatory delays can override the chart in minutes. But technical invalidation matters more in the near term, because one daily candle above $0.8117 breaks the bearish setup.
Expert Outlook: Sui Price Prediction
According to CoinGabbar analysis, the evidence leans bearish. Price trades below the $0.8284 50 EMA, and the RSI reads 36.43. That keeps this Sui price prediction pointed at a test of the $0.7659 support level first.
But rising stablecoin supply gives buyers an argument to defend that level. A daily candle trading above $0.8117 would be the first sign the channel is breaking up.
Disclaimer: This article is for information only and isn't financial advice. Traders should do their own research and risk only what they can afford to lose.