SUI just gave traders something to watch closely. The SUI price prediction picture has turned tense after a sharp, high-volume selling candle pushed the price straight through a level that ha
SUI just gave traders something to watch closely.
The SUI price prediction picture has turned tense after a sharp, high-volume selling candle pushed the price straight through a level that had held for weeks, and the way the next few hours play out could set the tone for the rest of the move.
This piece is prepared by CoinGabbar's technical desk using chart patterns, live market data, and liquidation figures. It is for informational purposes only and should not be treated as financial advice.
The levels discussed reflect the daily timeframe and should be rechecked once the current candle closes, since the setup is still developing at the time of writing.
Methodology and Data Sources
This SUI price forecast is built from the SUI/USDT perpetual contract on Binance, viewed on the 1-day timeframe through TradingView.
All support and resistance levels referenced here come directly from marked swing highs and swing lows on that chart, not from any independently calculated indicator.
Market data is sourced from CoinGlass, and liquidation figures are pulled from CoinGlass's SUI liquidation tracker.
The forecast covers the near term, roughly the next several daily candles, and will need revisiting once the current candle closes.
SUI Market Snapshot
SUI is trading at $0.6443, down 4.67% over the past 24 hours.
Futures volume over the same period stands at $516.20M against spot volume of $64.30M, showing that derivatives activity is currently driving most of the price action.
Open interest sits at $508.61M on a market cap of $2.62B, while circulating supply is 4.07B out of a total and max supply of 10.00B SUI.
The gap between futures volume and spot volume is worth noting.
When futures volume runs several times higher than spot volume, price swings tend to be driven more by leveraged positioning than by genuine spot demand, which can make moves sharper in both directions.
Source: CoinGlass, August 18, 2026.
SUI Liquidation Data Today
Long-side liquidations have dominated the last 24 hours, a signal that leveraged buyers were caught offside as price fell.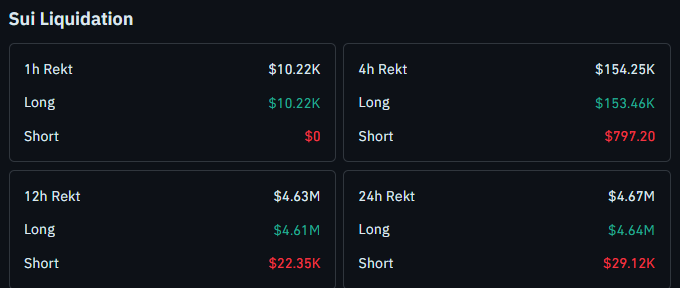
In the past hour alone, long-side liquidations totaled $10.22K with no short-side liquidations recorded.
Over 4 hours, long-side liquidations reached $153.46K against just $797.20 on the short side.
The picture gets more dramatic over longer windows.
In the past 12 hours, long-side liquidations hit $4.61M compared to $22.35K in short-side liquidations, and over 24 hours the total reached $4.67M in liquidations, with $4.64M coming from long positions and only $29.12K from shorts.
This heavy skew toward long-side liquidations confirms that the recent drop caught a large number of leveraged buyers off guard, adding fuel to the selling pressure seen on the chart.
Source: CoinGlass , SUI liquidation data, August 18, 2026.
SUI Ecosystem News Today
Away from the charts, there is a fresh development worth watching.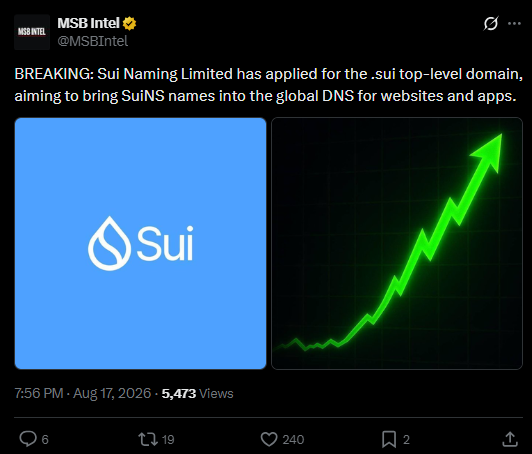
According to a post from MSB Intel dated August 17, 2026, Sui Naming Limited has applied for the .sui top-level domain, with the goal of bringing SuiNS names into the global DNS system for websites and apps.
If approved, this would let Sui-based domain names function like standard web addresses rather than staying limited to blockchain applications, which could widen SUI's use case beyond trading and DeFi.
This kind of infrastructure news does not usually move price in the short term, but it adds a longer-term bullish narrative for the network's utility, separate from the current technical setup.
Source: MSB Intel on X, August 17, 2026, 7:56 PM.
SUI Technical Analysis: Falling Wedge Under Pressure
Price is currently trading inside a falling wedge pattern on the daily chart, a structure that typically signals a slowing downtrend and often resolves with a breakout to the upside.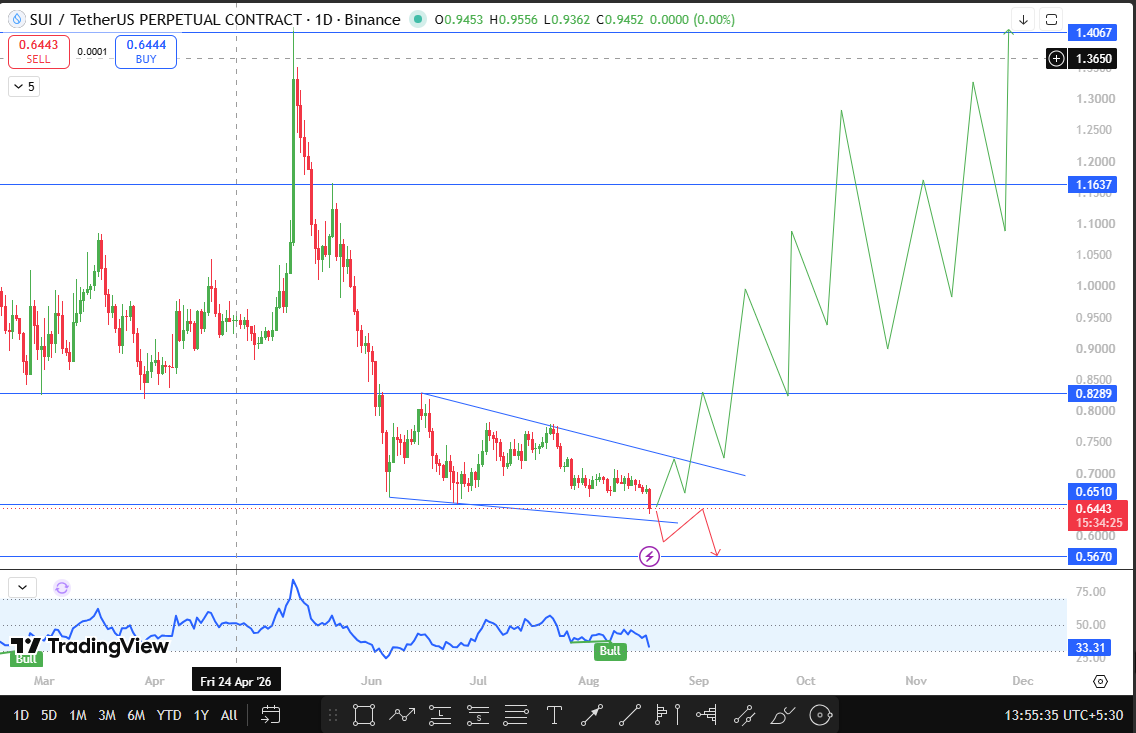
However, the setup has just been complicated by a fresh development.
Price has broken below the swing low from June 23, and it did so with an aggressive, high-volume selling candle.
This is not a quiet breakdown. The volume behind the move suggests real selling conviction, not just a low liquidity wick.
Adding to the uncertainty, the daily candle still has around 15 hours left before it closes, meaning the current move is not yet confirmed.
The chart's built-in momentum tag currently reads Bull at 33.31, sitting closer to the lower half of its range, which lines up with the recent weakness rather than contradicting it.
Two scenarios are now in play. If SUI gets rejected from current levels and manages to close back above $0.6510 and then sustains above that support on the following candles, it would suggest the wedge breakdown was a fakeout rather than a genuine trend shift.
In that case, a breakout higher would open the door toward the resistance levels outlined below.
On the other hand, if SUI closes below $0.6510 and fails to reclaim it, the breakdown from the June 23 swing low would stay valid, and the next relevant support comes into play lower down.
SUI Support and Resistance Levels
Type
Level
% From CMP
Note
Resistance 3 (Major)
$1.4067
+118.1%
Old swing high
Resistance 2
$1.1637
+80.5%
Old swing high
Resistance 1 (Near-term)
$0.8289
+28.5%
Old swing high
Key Trigger / Flip Zone
$0.6510
+0.9%
Recently broken swing low area
Support 1
$0.5670
-12.1%
Next support if breakdown holds
SUI Risk-Reward Table
Case
Trigger
Target
Bullish
Daily close above $0.6510 and sustained hold above it
$0.8289, then $1.1637, then $1.4067
Bearish
Daily close below $0.6510 with no reversal
$0.5670
What Would Change This SUI Price Prediction
The next daily candle close is the deciding factor here.
A confirmed close above $0.6510 that holds on the following session would shift the near-term bias. back toward the bullish wedge breakout scenario.
A close below $0.6510 without any reversal attempt would confirm the breakdown and keep $0.5670 as the next level in focus.
Traders should also watch whether long-side liquidations continue to accumulate, since that would point to further forced selling rather than organic demand returning.
Risk Considerations
Leveraged positioning is elevated right now, given the gap between futures and spot volume plus the scale of long-side liquidations already seen.
This raises the risk of sharp, fast moves in either direction, including false breakouts above or below the key levels discussed.
Traders using leverage should account for this volatility and avoid treating any single level as a guaranteed reversal point.
Bull, Base, and Bear Case
Bull Case: Price reclaims $0.6510 on a daily close and holds it, invalidating the wedge breakdown and opening a path toward $0.8289 and eventually the major resistance zone near $1.4067.
Base Case: Price stays in a range bound around the $0.6443 to $0.6510 zone for the next few sessions while the market waits for a confirmed daily close in either direction.
Bear Case: Price closes below $0.6510 and continues lower without reclaiming it, bringing $0.5670 into play as the next support test.
Glossary
CMP: Current Market Price, the live trading price of an asset at the time of writing.
Open Interest: The total value of outstanding futures or perpetual contracts that have not yet been settled or closed.
Liquidation: The forced closure of a leveraged trading position when losses reach a level the exchange requires to protect against further losses.
Perpetual Futures: A type of derivative contract that tracks an asset's price without an expiry date, commonly used for leveraged trading.
Falling Wedge: A chart pattern formed by two converging downward-sloping trendlines, generally seen as a pattern that can resolve with a breakout to the upside once confirmed.
Disclaimer
This article is for informational purposes only and does not constitute financial advice. Cryptocurrency markets are highly volatile, and prices can move sharply in either direction. CoinGabbar and the analyst do not hold a position in SUI at the time of publication. Readers should conduct their own research and consult a qualified financial advisor before making any investment decisions.