This Sui price prediction comes at a moment worth paying attention to. Price has just broken free of a pattern that had boxed it in for weeks, and the candle behind that move was not subtle.
This Sui price prediction comes at a moment worth paying attention to.
Price has just broken free of a pattern that had boxed it in for weeks, and the candle behind that move was not subtle.
There is also a bigger story building in the background, one that stretches well beyond this week's chart. Between the near-term setup and the longer-term picture, this is one of the more layered Sui price prediction updates in a while.
The levels below come from the daily and weekly charts and reflect a technical view, not a guaranteed outcome.
Sui Price Right Now: Live Data and Key Levels
Metric
Value
CMP (Current Market Price)
$0.7906
24-Hour Change
+9.05%
Market Cap
$3.22 billion
Futures Volume (24h)
$1.17 billion
Spot Volume (24h)
$202.83 million
Open Interest
$632.28 million
Circulating Supply
4.07 billion
Total Supply
10.00 billion
Max Supply
10.00 billion
Futures volume of $1.17 billion against spot volume of $202.83 million works out to roughly 5.8 times more futures activity than spot, an independently calculated ratio showing leveraged traders are driving most of today's move.
Open interest of $632.28 million against a $3.22 billion market cap puts leverage exposure at close to 19.6% of market cap, an elevated reading that raises the odds of sharp swings in either direction.
With 4.07 billion SUI circulating out of a 10.00 billion max supply, close to 5.93 billion SUI, about 59.3% of the eventual max supply, is still outside current circulation, a meaningful overhang to keep in mind on any extended rally.
Source: CoinGlass live market data, August 21, 2026. Chart source: TradingView, SUI/USDT Perpetual, Binance, 1-day and 1-week timeframes.
Methodology Behind This Sui Price Prediction Today
This price prediction is built on the daily and weekly SUI/USDT perpetual charts on Binance, viewed through TradingView.
CMP is taken from the live price marked on the daily chart, and target and support levels are pulled directly from old swing highs and lows on each respective chart.
A Trader's View on SUI's Weekly Channel
Fresh chart commentary is adding context to this Sui coin price forecast.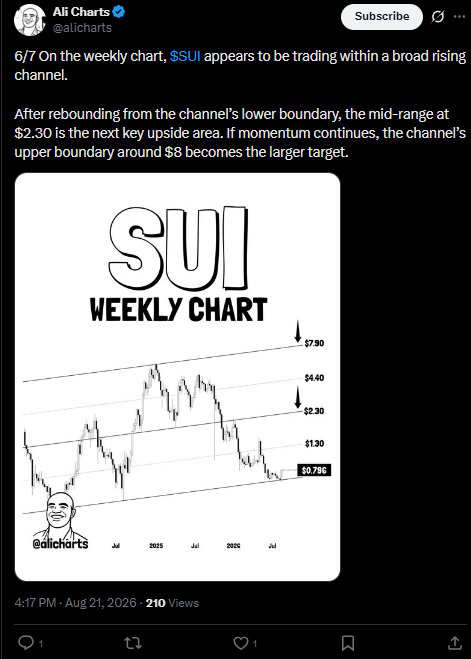
According to Ali Charts on X, Price is trading within a broad rising channel on the 1-week chart.
After rebounding from the channel's lower boundary, the mid-range near $2.30 is flagged as the next key upside area, with the channel's upper boundary near $8 as the larger target if momentum continues.
This view lines up closely with the structure covered later in this piece, and it adds independent support to the idea that SUI's bigger picture remains constructive well beyond the current daily setup.
SUI Liquidation Data Today
The liquidation picture has mostly favored short sellers over the past 24 hours, but the most recent hour tells a slightly different story.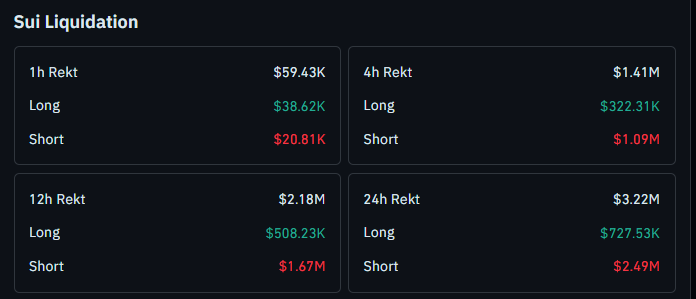
In the last hour, long-side liquidations of $38.62K outpaced short-side liquidations of $20.81K, a sign of a brief pullback catching some late buyers.
Zoom out, though, and shorts have taken the bigger hit.
The 4-hour window shows $1.09M in short liquidations against $322.31K in long liquidations, the 12-hour window shows $1.67M short against $508.23K long, and the 24-hour window shows $2.49M short against $727.53K long.
That pattern lines up with the strength of the wedge breakout, with short sellers getting squeezed repeatedly as SUI pushed higher.
Source: CoinGlass liquidation data, August 21, 2026.
SUI Trend and Momentum: Key Takeaways for Traders
Price broke out of a falling wedge on the daily chart with an aggressive, high-volume candle
CMP is trading near $0.7906, up 9.05% over the past 24 hours per CoinGlass
A close above $0.8289 opens the door toward $1.1637, then $1.4147, then $1.7105.
A break and close below $0.6510 would fail the breakout, with $0.5670 as the next support
On the weekly chart, Price is sitting near a support zone between $0.7933 and $0.6351
A weekly close above $1.4225 that sustains near the channel trendline could open a much bigger move toward $3.1014, $4.4480, $5.3722, and a fresh all-time high near $7
This is a short-term technical read layered with a longer-term view. Even strong breakouts can fail, so these levels should not be treated as guaranteed outcomes.
Sui Price Prediction: Daily Chart Breakout Analysis
Price has broken out of a falling wedge on the daily chart, and it did so with an aggressive candle rather than a quiet drift higher, a sign of real conviction behind the move.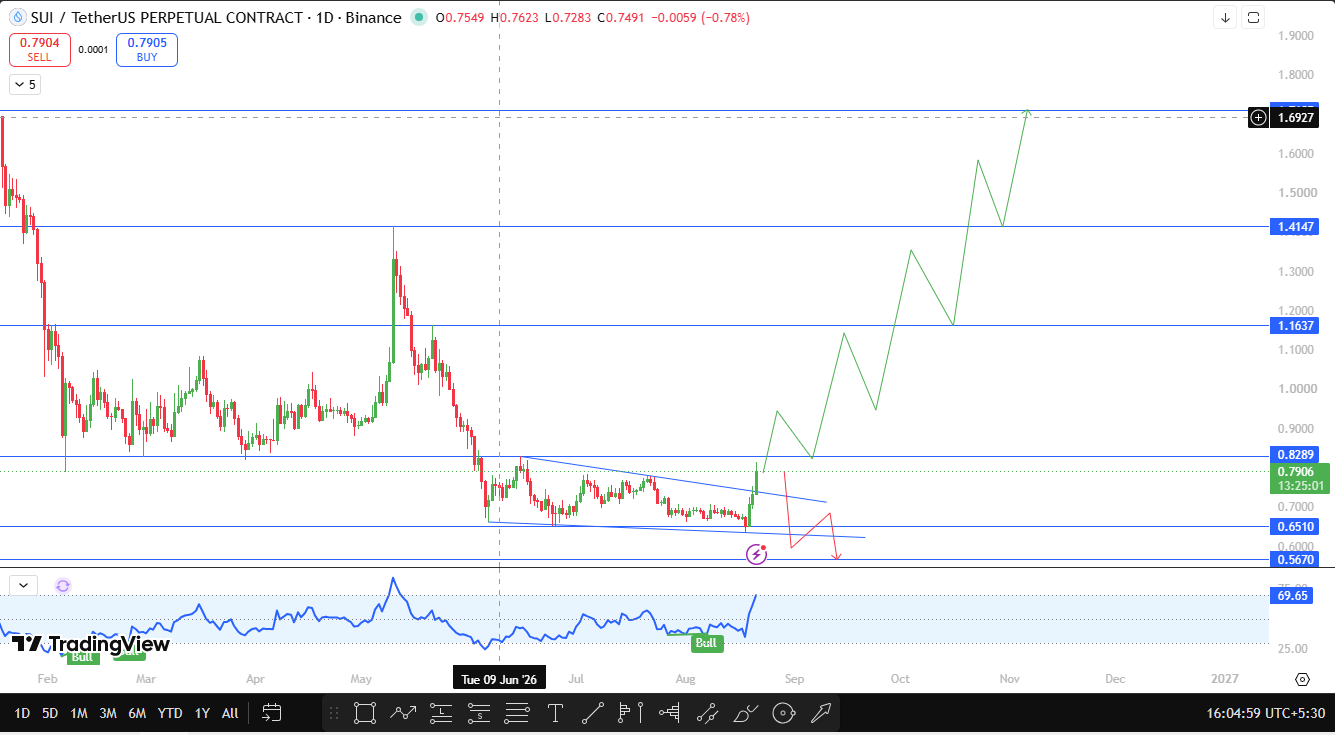
If the price breaks and closes above $0.8289, the next levels to watch are $1.1637, $1.4147, and $1.7105, all marked off old swing highs on the chart.
On the downside, this breakout would fail if the price breaks and closes below $0.6510.
That would open the door toward $0.5670 as the next support, an old marked swing low.
SUI Weekly Chart: The Bigger Picture
Zooming out to the weekly timeframe changes the scale of what is possible for SUI.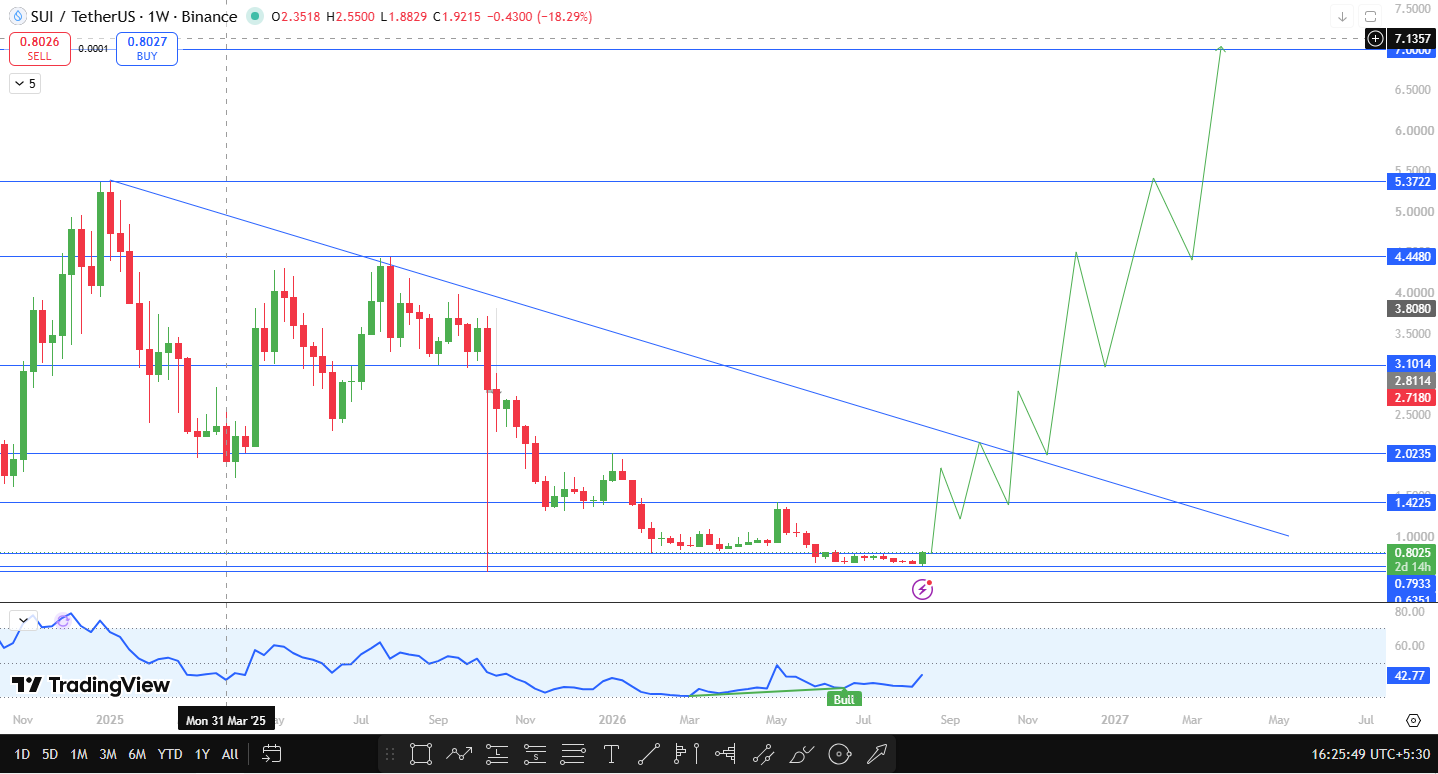
Price is currently sitting close to a support zone between $0.7933 and $0.6351, both old marked levels that have held on this timeframe before.
If the price breaks and closes above $1.4225 and sustains that move near the long-term trendline before breaking out further, the next major resistance levels are $3.1014, then $4.4480, then $5.3722.
Beyond that, a move toward $7 would mark a fresh all-time high for SUI.
These are long-range targets built on a much bigger structure than the daily setup above, and they would likely take considerable time to play out even in a strong bull scenario.
Technical Outlook Snapshot for This Sui Price Prediction
Indicator
Signal
Daily Chart Pattern
Falling wedge, breakout on an aggressive high-volume candle
Weekly Chart Structure
Broad rising channel, price near the $0.7933 to $0.6351 support zone
Momentum Panel (TradingView, 1D)
69.65, Bull tag active
Near-Term Bias
Bullish above $0.6510, confirmation needed above $0.8289
SUI Support and Resistance Levels Worth Watching Now
Level Type
Price
% From CMP
Note
Extended Target
$7.00
+785.53%
1-week target, potential new all-time high
Resistance 3
$5.3722
+579.61%
Old weekly swing high
Resistance 2
$4.4480
+462.68%
Old weekly swing high
1-week Resistance 1
$3.1014
+292.30%
Old weekly swing high
1-week Breakout Trigger
$1.4225
+79.93%
1-week trendline breakout level
Daily Resistance 3
$1.7105
+116.36%
Old daily swing high
Daily Resistance 2
$1.4147
+78.94%
Old daily swing high
Daily Resistance 1 (trigger)
$1.1637
+47.20%
Old daily swing high
Daily Resistance 0 (trigger)
$0.8289
+4.84%
Old daily swing high, breakout confirmation level
Current Price
$0.7906
0%
Live CMP, Binance perpetual, 1D chart
Weekly Support Zone High
$0.7933
+0.34%
Weekly support zone, upper edge
Daily Support 1 (trigger)
$0.6510
-17.66%
Old daily swing low, breakdown trigger
Weekly Support Zone Low
$0.6351
-19.67%
Weekly support zone, lower edge
Daily Support 2
$0.5670
-28.28%
Next old daily swing low
SUI Risk-Reward Table for the Wedge Breakout Setup
Case
Trigger
Target
Bull Case (Daily)
Sustained close above $0.8289
$1.1637, then $1.4147, then $1.7105
Bull Case (Weekly)
Sustained close above $1.4225
$3.1014, then $4.4480, then $5.3722, then $7
Bear Case
Sustained close below $0.6510
$0.5670
Setup invalidation
Close back below $0.6510.
Falling wedge breakout fails, weekly support zone comes into focus
Invalidation Level for This $Sui Price Forecast
This Sui price forecast stays bullish while $SUI holds above $0.6510. It would be invalidated by a break and close below that level, which would put the weekly support zone between $0.7933 and $0.6351 to a real test and shift focus toward $0.5670.
How Bitcoin Sentiment Could Move This $SUI Price Outlook
$SUI, like most large-cap altcoins, tends to take direction from the broader tone Bitcoin sets across the market.
Strength in Bitcoin could help $SUI clear $0.8289 faster and support the bigger weekly move, while sudden weakness on Bitcoin could pressure the price back toward the weekly support zone.
This $Sui price outlook is based on SUI's own chart structure, but Bitcoin remains a factor worth watching alongside it.
Planned Update for This Sui Price Prediction
This price prediction will be revisited if the price closes decisively above $0.8289 or below $0.6510 on the daily chart, or if the weekly structure shifts meaningfully.
Glossary of Terms Used in This $SUI Technical Analysis
CMP: Current Market Price, the live traded price at the time of analysis
Open Interest: The total value of outstanding, not yet settled derivative contracts for an asset
Liquidation: The forced closure of a leveraged trading position when losses exceed the margin held
Falling Wedge: A converging downward-sloping pattern that often breaks upward, signaling a possible trend reversal
Rising Channel: A pattern formed by two parallel upward-sloping trendlines, with price bouncing between them
CoinGabbar Technical Analyst View on $SUI Price Action
Bull Case: A sustained close above $0.8289 confirms the wedge breakout has real strength, opening a path toward $1.1637 and $1.4147, supported by consistent short-side liquidations.
A further weekly close above $1.4225 would put the much larger $3.1014 to $7 range in view over time.
Base Case: Price consolidates between $0.6510 and $0.8289 on the daily chart as the market digests the breakout, while the weekly support zone between $0.7933 and $0.6351 continues to hold.
Bear Case: A close below $0.6510 fails the wedge breakout and puts the weekly support zone to the test, opening room toward $0.5670 if that zone gives way.
Disclaimer
This article is for informational purposes only and should not be treated as financial advice. Cryptocurrency markets are highly volatile, and readers should do their own research before making any investment decisions. CoinGabbar and the analyst do not hold a position at the time of publication.