SUI Rebound Faces Resistance as $7 Target Comes Into View
Analyst sees a possible move toward $1 if SUI reclaims former support, now acting as resistance. Giannis Andreou identifies 1.20–1.50, 1.80–2.30 and 3.80–4.50 as barriers before a potential m
A
AnonymousCryptoCompass newsroom
November 2, 2026
2 min read
NEWS
CryptoCompass editorial visual for markets coverage.
Analyst sees a possible move toward $1 if SUI reclaims former support, now acting as resistance.
Giannis Andreou identifies 1.20–1.50, 1.80–2.30 and 3.80–4.50 as barriers before a potential move toward $7.
SUI trades below its 50-day and 200-day moving averages, with support at 0.83–0.85 and immediate resistance at 0.90–0.91.
Sui has fallen below both major moving averages after October selling erased much of its September recovery, while analysts outline sharply different price targets. Michael van de Poppe sees a possible move toward $1 if SUI reclaims former support. Giannis Andreou has mapped a longer-term route toward $7, conditional on several major breakouts.
Van de Poppe Watches a Reclaim Toward $1
Van de Poppe said SUI had reached the August or September low sweep seen across several altcoins during the broader market correction. He said the token could move quickly if it climbs back above recent support, which has now become resistance. Based on that setup, he would not be surprised to see SUI reach $1.
Andreou Identifies the Levels Needed for $7
Andreou places SUI's current weekly demand zone between $0.80 and $0.95, about 80% below its $4.48 rebound high. He said buyers must first reclaim 1.20–1.50, followed by supply between $1.80 and $2.30.
Further resistance sits at 3.80–4.50 and 5.00–5.40. A sustained breakout above the visible $5.37 peak would strengthen the possibility of moves toward $6.72 and potentially $7.
Andreou said each step requires confirmed breakouts and successful retests. If demand fails, he identified 0.55–0.70 as the next major base. A break below $0.55 would weaken the recovery scenario.
SUI Chart Shows October Weakness
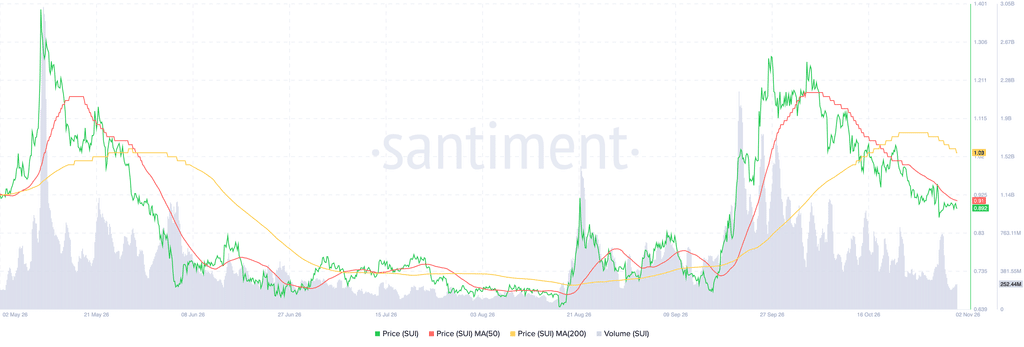
The November 2 chart shows SUI near $0.892 after retreating from September highs approaching $1.27. The token rallied above $1.20 in late September, but selling pressure continued through October.
Source: Santiment
SUI now trades below its 50-day moving average near $0.91 and its 200-day average around $1.03. Volume exceeded $2 billion during September's rally, but the latest reading fell to approximately $252.44 million.
The chart places immediate support at 0.83–0.85 and resistance at 0.90–0.91. A move above $1.03 could open levels at $1.15 and $1.25. However, a break below $0.83 could expose $0.735 and $0.65.
The rise of Ripple’s RLUSD stablecoin has revived an old debate around XRP: if institutions can settle payments using a dollar-backed asset, do they still need XRP? Attorney and longtime XRP
In Brief: Whale Alert tracked 80 million XRP worth $100.9 million moving from a Binance hacker wallet into two unidentified cryptocurrency addresses. Binance began restoring withdrawals acros
Strategy, the largest corporate holder of Bitcoin, has expanded its BTC portfolio with the purchase of 811 additional coins at an average price of $80,846 each. The accumulation took place be


 Source: Santiment