SUI returns to its 200-day moving average near $0.89 after breaking above the indicator in September. Perpetual liquidation spikes increased during September and October as leveraged traders
- SUI returns to its 200-day moving average near $0.89 after breaking above the indicator in September.
- Perpetual liquidation spikes increased during September and October as leveraged traders faced repeated forced closures during sharp price swings.
- Holding $0.89 could put $1.00 back in view, while a breakdown may expose lower support.
SUI is approaching a crucial technical level, with its latest pullback bringing the 200-day moving average into focus.
CryptoBullet Compares the Current Retest With May's Rejection
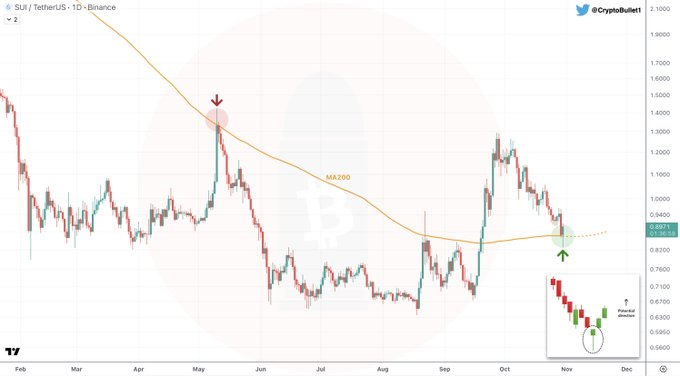
CryptoBullet has drawn attention to the difference between the two moving average tests. The analyst recalls how SUI approached the 200-day average during May. That earlier attempt failed, leaving the long-term indicator as overhead resistance.
Source:
X
The May rally carried SUI towards the $1.40 region before losing steam. Sellers stepped in, and the price subsequently entered a prolonged downward move. By June, the token had surrendered much of its earlier recovery.
Trading remained subdued throughout the summer, with prices moving within lower ranges. Several recovery attempts failed to produce a sustained move higher. The market eventually changed direction during September as buyers returned.
SUI climbed above the descending 200-day average during that recovery. The advance continued into October, taking the token towards $1.30. CryptoBullet now views the pullback towards $0.89 as a possible support test.
Liquidation Data Shows Renewed Activity Among Leveraged Traders
The perpetual liquidation chart offers another account of SUI's recent trading conditions. It tracks forced closures of leveraged long and short positions. Green bars represent long liquidations, while red bars represent short liquidations.

Source:
Coinglass
Early May recorded the largest visible liquidation event on the chart. A red bar approached $19.76 million around May 10. Several green bars later approached $9.88 million during late May and June.

Liquidation activity became quieter between mid-June and August. SUI traded mostly between $0.70 and $0.80 during this stretch. Smaller bars suggested fewer large forced closures across perpetual markets.
The picture changed again during September as prices began recovering. Several liquidation spikes appeared between September 18 and October 8. Both bullish and bearish traders faced forced closures during these volatile sessions.
SUI Price Outlook Hinges on the $0.89 Level
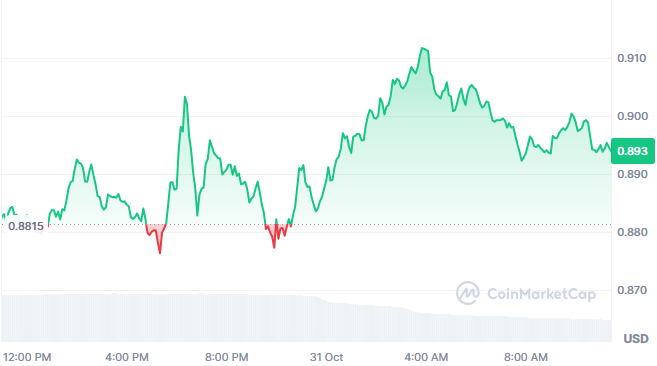
The intraday chart as of writing places SUI around $0.8951, up 1.15% daily. Price previously fell towards $0.876 before buyers mounted a recovery. That rebound carried the token towards an intraday high near $0.912.
Source:
Coinmarketcap
However, sellers returned around 0.910–0.912, pushing prices lower. SUI subsequently settled around $0.895, leaving the immediate direction unresolved. The 0.880–0.882 area remains an important short-term support zone.
Trading volume also presents a concern for the current recovery attempt. Reported 24-hour volume declined by 52.78% according to supplied market data. Lower participation leaves the latest advance without strong volume confirmation.
A sustained move above $0.900 would give buyers another recovery target. The $1.00 level would then become an important price reference. Beyond that, traders may watch the October peak around 1.25–1.30.
A daily close below the moving average would weaken CryptoBullet's bullish interpretation. Such a move could expose the $0.80 region to another test. For now, the market must show whether buyers can defend $0.89.