SUI faces renewed selling near $0.95, while resistance around $0.98 could determine whether buyers regain control of short-term price action. The weekly breakout needs a successful retest, wi
- SUI faces renewed selling near $0.95, while resistance around $0.98 could determine whether buyers regain control of short-term price action.
- The weekly breakout needs a successful retest, with 0.70–0.85 marked as the re-entry zone and $0.50 defining invalidation.
- Bull-market targets of $5, $10, and $20 remain conditional, while liquidation spikes show how quickly leveraged positions can unravel.
SUI is under pressure following its recent pullback, but a weekly breakout structure has provided a different recovery scenario that requires a recovery of price levels.
Weekly Breakout Depends on Holding Support
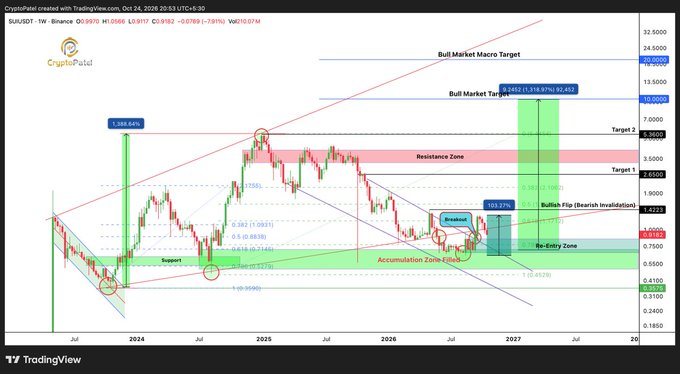
Crypto Patel's weekly chart presents a possible end to a descending structure following prolonged accumulation. The analyst identifies 0.70–0.85 as the re-entry zone after a potential pullback. However, the setup requires buyers to defend that area rather than surrender it.
Source:
X
The lower 0.50–0.70 range marks the proposed accumulation zone. Price spent extended periods within this region after previous rallies faded. If the short term price closes below $0.50, the bull market described in the post will be broken.
The downtrend line had held back rallies and failed to provide any support. Its breach offers a possible change in direction, but the breakout still needs confirmation. A return beneath the broken structure would raise doubts about whether the move can last.
The chart places another important threshold near $1.42.Sustaining a level above that could bolster the recovery argument, and leave some space for additional improvements. However, if these rejections continue, it may drive attention back to lower support.
Liquidation Data Shows How Quickly Conditions Change
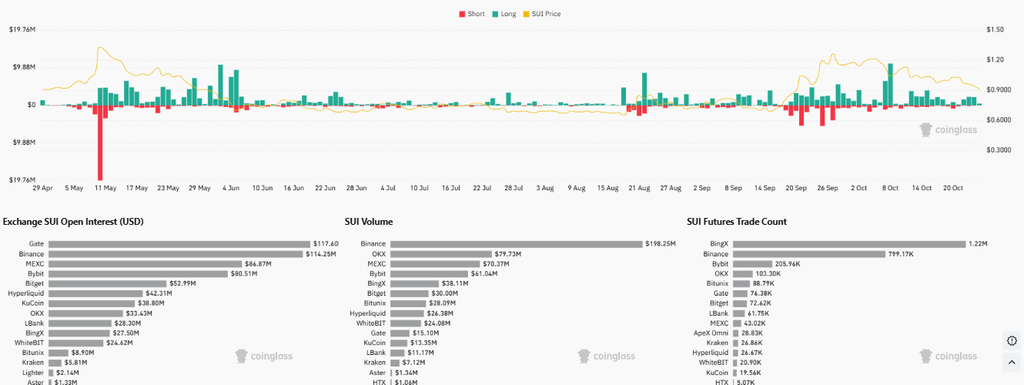
The supplied perpetual liquidation chart tracks price movements and forced closures between late April and October. Green bars represent liquidated long positions, while red bars represent liquidated shorts. Large spikes appear during periods of sharp price movement.
Source:
Coinglass
Around May 11, a particularly tall red bar dominates the chart. Its size indicates a concentrated burst of short liquidations during that session. The displayed data also shows liquidations occurring as prices moved in the opposite direction.

During June, the price fell toward 0.60–0.70 and remained weak through much of summer. Liquidation spikes generally became smaller during this period. Activity picked up again when prices climbed sharply during the second half of September.
Exchange figures show Gate and Binance holding roughly $117.6 million and $114.25 million in open interest. Binance is the leader in the futures volume market, with around $198.25 million. BingX has logged approximately 1.22 million futures transactions, which is based on transaction volume rather than the number of contracts outstanding.
Recent Price Action Leaves Buyers With Work to Do
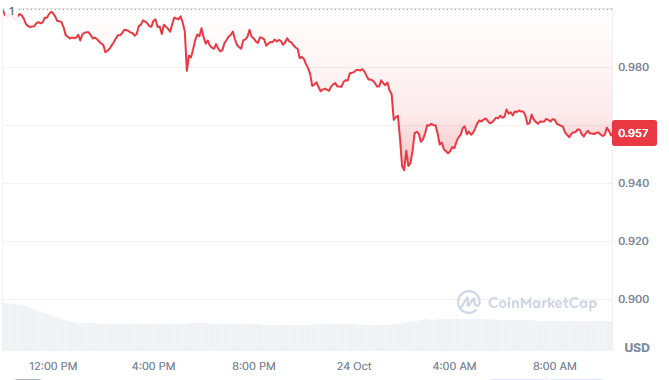
The latest 24-hour chart shows a decline from around $1.00, followed by an incomplete rebound. The price tag is $0.9102 and the line plots at approximately $0.957. Those readings are not the same, and should not be considered a price observation.
Source:
Coinmarketcap
Selling gathered pace after the plotted price fell beneath $0.98. A sharp drop carried it toward $0.945 before buyers pushed it higher. That rebound failed to recover the earlier trading range.
The plotted session places resistance around 0.960–0.965, followed by $0.980. Reclaiming both areas would give buyers a stronger footing. In the short term, the chart remains any bittersweet, with the inability to catch up with lost ground.
The negatives are that there is a good reference point at $0.950 and a plotted low at $0.945. If it breaks below that low, it is likely to trigger another selling rally. The area would have to be fenced off to keep the area from deteriorating more.
The weekly and daily chart, then, are not one direction, but two different time frames. The proposed $5, $10, and $20 targets depend on a much broader recovery. For now, the retest, the $1.42 threshold, and protection of $0.50 remain central to the longer-term setup.