According to Alpha Crypto Signal, ARB is consolidating above a horizontal support level after its recent rise. This technical setup places importance on a potential retest of this support for
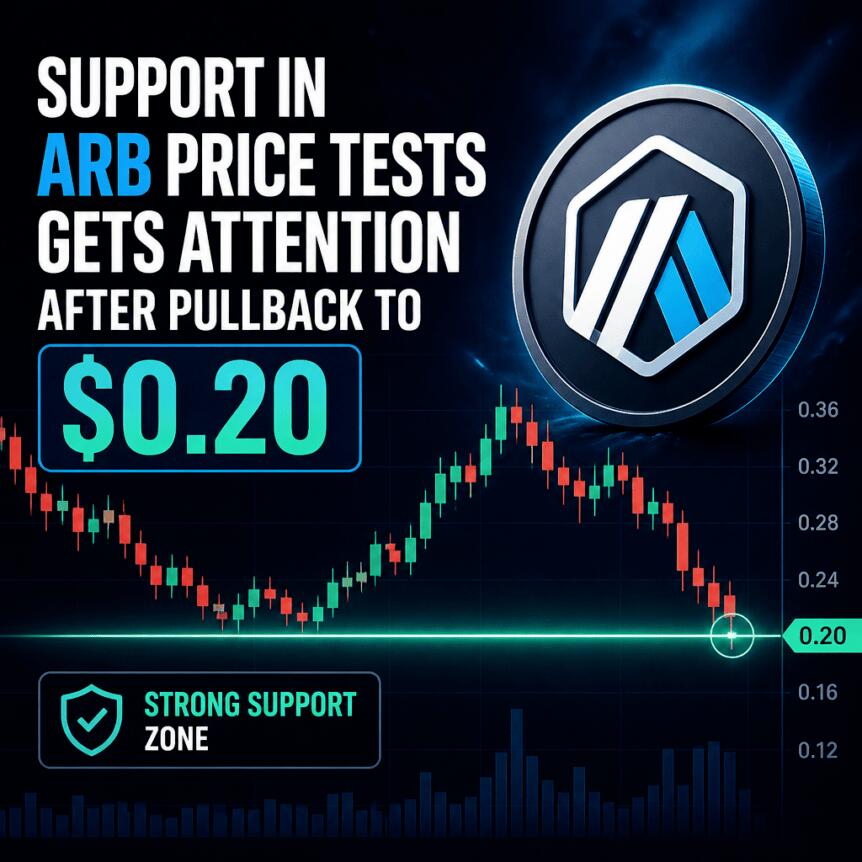
According to Alpha Crypto Signal, ARB is consolidating above a horizontal support level after its recent rise. This technical setup places importance on a potential retest of this support for a possible bullish reaction before any further move.
The chart shows ARB rising from the $0.13–$0.15 area. Before this move, ARB traded sideways, followed by a breakout around mid-September. It climbed above the $0.20 level and reached $0.25.
This pattern has generally been higher highs and higher lows, but it has faced pressure due to the recent pullback.
Increased Selling Pressure in Recent Trading Sessions
As seen on the chart, there have been several rejections near the $0.23–$0.24 area. Each rally has weakened, and another downtrend has emerged, leading to lower highs in recent price action.
The intraday chart shows ARB trading at $0.2087, an 8.8% drop. The total 24-hour volume is around $379 million, while market capitalization is close to $1.41 billion.
According to CoinMarketCap statistics from September 28, ARB traded at $0.21. The large daily trading volume was seen across the market, suggesting increased volatility after the prior uptrend.
An increase in volume on the downside adds significance to the retracement. Still, high volume alone is not enough evidence of an established trend reversal.
Rising Channel Maintains the Recovery Formation
The rising channel remains visible on the chart, with the lower line moving near the horizontal support region. Together, these formations create a closely watched technical zone for ARB.
A bullish reaction would likely see ARB consolidate around support and attract new buying pressure. Rising volume during a reaction could also indicate that buyers are returning.
The $0.20 level continues to act as a psychological reference point. Holding above the region would give the token a chance to move again toward resistance.
ARB Faces a Key Technical Decision
The chart suggests ARB could move toward roughly $0.28–$0.30 if support holds and ARB successfully reclaims the relevant consolidation highs. However, that projection depends on price first stabilizing around the current support zone.
For now, ARB remains between established support and renewed selling pressure. A reaction around $0.20 and the lower channel boundary could therefore provide the next key signal for the token’s short-term direction.
This article was originally published as Support in ARB Price Tests Gets Attention After Pullback to $0.20 on Crypto Breaking News – your trusted source for crypto news, Bitcoin news, and blockchain updates.