Talus Price Prediction: Can US Extend Its Sharp Rally This Week Ahead Talus is having one of those days traders talk about for weeks. The token jumped over 22% in 24 hours, and it's not slowi
Talus Price Prediction: Can US Extend Its Sharp Rally This Week Ahead
Talus is having one of those days traders talk about for weeks. The token jumped over 22% in 24 hours, and it's not slowing down quietly. Buyers pushed the price into a rising channel that's been building since early July. But strength like this raises the same question every time: is there real fuel behind it, or is this a squeeze that fades by Friday?
Talus Price Prediction Today: A Rally That Refuses To Cool Off
Talus price prediction chatter picked up fast once the token cleared its prior resistance zone with volume behind it. The move didn't come from nowhere. Trading on Sui-based decentralized exchanges spiked, and liquidation data shows short sellers got squeezed hard over the last four hours.
That's often the spark, not the whole story. What happens next depends on whether buyers can hold above the mid-channel or whether this turns into a blow-off top. Can this pace hold through the weekend?
Key Takeaways
Direction:Bullish, trading inside an ascending channel above its 50 EMA
Why:A short squeeze plus rising DEX volume pushed price through resistance
Short-term range:$0.028 to $0.040 over the next one to four weeks
Invalidation: A close below $0.010252 would break the current structure
Talus Coin Overview And SnapshotMetricValueCoin NameTalus NetworkTickerUSBlockchainSui NetworkToday High$0.03474Today Low$0.02477RSI Level (14, 4H)71.91Token TypeUtility / GovernanceToken CategoryAI Agent InfrastructureMarket Cap$68.96M24H Volume$11.58M24H Volume Change+78.76%Circulating Supply2.2B USMax Supply10B US24H Change+22.58%
Data as of July 15, 2026. Figures sourced from CoinMarketCap
Talus also trades actively on the Sui network's own DEX layer, where a snapshot of top holder wallets on Suiscan shows a fairly wide spread of large accounts, not just one or two dominant whales.
Talus Network Background: What The Coin Actually Does
Talus runs on Sui and builds infrastructure for onchain AI agents. It's a young project, and the team runs incentive programs to pull agent-based DeFi builders onto its framework.
Talus Price History And Recent Performance
Talus climbed from roughly $0.0053 in late May to today's price near $0.031. Most of that move happened in the past month. The token hit an all-time high of $0.03474 earlier today, and it's still up more than 1,091% from its March low.
Why Talus Network Matters Right Now
This isn't a rally built purely on price charts, though it's landing whilethe broader crypto market climbs too. Talus Labs recently highlighted results from its Talus/acc program, which backs teams building agentic use cases on its framework.
Second-place winner Agama Finance is building a yield layer for real-world asset tokens, bridging private credit demand with DeFi liquidity through underwriting-first vaults. The team says it has $4 million in private credit ready to deploy through an automated allocation engine with continuous risk monitoring.
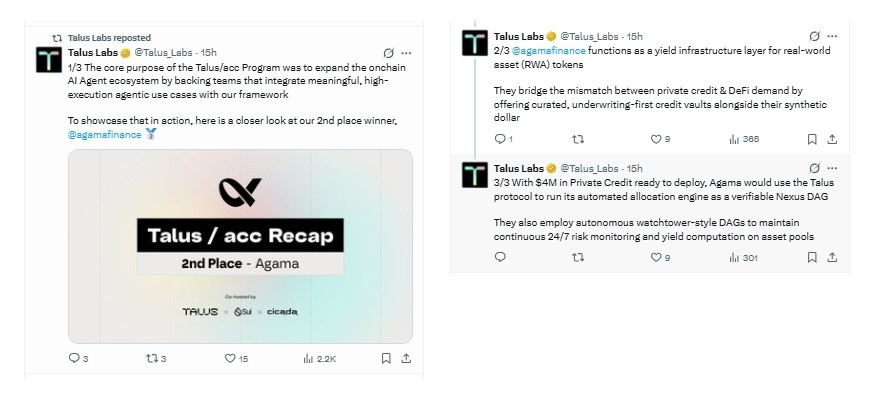
Source: Posted on X by @Talus_Labs
That kind of real-world credit tie-in is the sort of narrative that can pull in longer-term holders, not just short-term flippers.
Talus Network Liquidation Data
Liquidations tell part of the story behind today's move. Over the past 24 hours, short positions on $US took the bulk of the damage.
WindowTotal LiquidationLongsShorts1H$22.07K$21.71K$361.154H$308.10K$27.25K$280.86K12H$331.63K$27.54K$304.09K24H$356.20K$28.83K$327.37K
Source: CoinGlass.
Short sellers got caught leaning the wrong way as price broke higher, and that squeeze added real fuel to the move, not unlike the setup behindBitcoin's key levels this month.
Talus Fundamental Analysis And Tokenomics
Talus has a 10 billion max supply, with only 2.2 billion circulating, roughly 22% of the total. FDV sits near $313.46M against a live market cap of $68.96M, a gap worth watching since unlock schedules for the remaining supply weren't in the available data. Liquidity relative to market cap is thin, around 1.38%, so large trades can move price more than on a deeper market.
Source: Data by Suiscan
Talus Technical Price Analysis: Chart Reading
$US trades at $0.03166 on the 4-hour chart, holding inside an ascending channel that's stayed intact since early July.
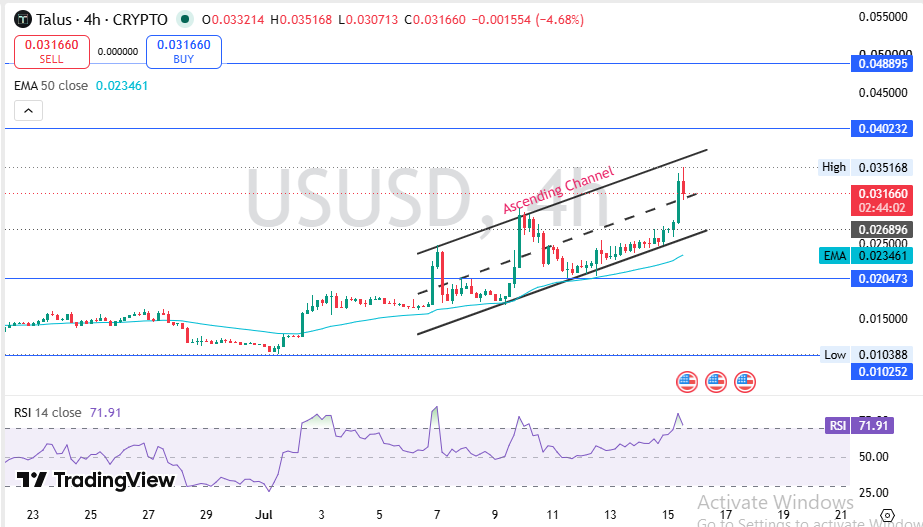
Source: TradingView.
Price sits above the mid-channel line and above its 50 EMA at $0.026896, which keeps buyers firmly in control of the short-term trend. The RSI reads 71.91. That's overbought, but not extreme for a coin moving this fast, and momentum readings like this can stay elevated for days once a real breakout is underway.
Support sits at $0.020473, the level that's held up the whole channel structure so far.
Resistance stacks at $0.040232, then $0.048895 above that.
A confirmed break above the first resistance, backed by real volume rather than a thin candle, opens the door toward the next level. Fail there instead, and expect some sideways consolidation before the next real move.
Talus Volume Heatmap Across Exchanges
Binance dominates $US trading volume by a wide margin, handling over $51.54M, more than triple its nearest competitor, a pattern similar to theBinance-driven volume surge behind SkyAI's recent move.
ExchangeVolumeBinance$51.54MBybit$16.58MBitget$8.11MGate$5.76MMEXC$4.26MBingX$2.54M
Source: CoinGlass.
Checking volume spread acrossmajor crypto exchanges is worth doing before assuming a rally is broad-based rather than concentrated on one venue.
How Talus Compares To Other Small-Cap Sui Tokens
Against peer small-cap Sui tokens, $US stands out for its volume-to-market-cap ratio of 16.41%, well above what most sub-$100M Sui-native tokens see on an average day. That's a sharper ratio than mostlarge-cap altcoins post on a quiet day, and it suggests real active interest, not a quiet coin pumped by one or two wallets.
Its holder count, just 106 on CoinMarketCap, is thin next to more established Sui names, and that adds volatility risk, even with Solana's own bullish setup showing what a deeper, more liquid market looks like by comparison.
Talus Short-Term Price PredictionTimeframeBearishBaseBullishKey Trigger24 Hours$0.028$0.031$0.035Holds above 50 EMA3-7 Days$0.024$0.033$0.038Volume stays elevated2-4 Weeks$0.020$0.032$0.040Breaks first resistance
These ranges come from the current channel structure, the 50 EMA level, and how RSI has reacted at similar readings on this chart, not too far off the level-based approach behindSolana's own bullish flip. Watch the $0.0269 EMA line. Lose it on a 4-hour close, and the bullish case weakens fast.
Talus Long-Term Price PredictionTimeframeBearishBaseBullishCatalyst Needed3 Months$0.015$0.030$0.048Sustained DEX volume growth6 Months$0.012$0.035$0.065Agama and similar apps scale usageEnd of 2026$0.010$0.040$0.080Broader Sui ecosystem adoption2027 Outlook$0.008$0.045$0.110AI-agent DeFi narrative holds
Talus needs more than a hype cycle to hold these levels. It needs projects like Agama to actually deploy capital and show usage. That's the honest long-term take.
Three Price Scenarios For Talus
Worst Case:Price breaks below $0.020473, EMA support fails, and the rally reverses toward $0.012 as short-term buyers exit.
Base Case: $US consolidates between $0.026 and $0.038, digesting gains before its next real directional move.
Best Case:A volume-backed close above $0.040232 opens a path to $0.048895 and beyond, extending the current bull run.
ScenarioPrice RangeWhat Triggers ItWorst$0.010 - $0.020Break below EMA and invalidation zoneBase$0.026 - $0.038Sideways digestion near current levelsBest$0.040 - $0.055Volume-backed breakout above resistanceKey Price Levels To Watch For Talus
Resistance Zone: $0.040232, with a stronger ceiling at $0.048895 if momentum carries through.
Support Zone: $0.020473 is the first real floor, the level that's held up the current channel structure.
Invalidation Zone: A close below $0.010252 would break the bullish thesis entirely and call for a fresh read on the chart.
Risk Factors Behind The Talus Prediction
Liquidity Risk:With liquidity sitting near 1.38% of market cap, a large sell order could move price more than a deeper market would allow.
Volatility Risk: Only 106 tracked holders means this is still a thin, small-cap coin, closer to the kind ofwhale concentration risk seen in other recent small-cap surges, where sentiment shifts fast.
What Breaks the thesis?:A wave of token unlocks against the 78% of supply not yet circulating, a broader crypto market pullback, or a loss of the current DEX volume trend would all undercut this bullish setup.
Analyst View And Final Thoughts On $US
The chart setup favors buyers right now. Price sits above the 50 EMA, inside a clean ascending channel, and RSI at 71.91 shows strong, not-yet-exhausted momentum.
A weekly close above the mid-channel line would confirm buyers are still driving this, not just short-covering.
One factor worth watching: whether Agama actually deploys that $4 million in private credit. Real usage would do more for credibility than another green candle.
The most important level stays $0.020473. Hold it, and the bullish case stays intact. Lose it, and this becomes a different conversation.
Talus price prediction models lean bullish for now, but this remains a small, thinly traded coin riding a fast, news-driven move.
Key Takeaways
Talus is up over 22% in 24 hours, trading inside an ascending channel above its 50 EMA
RSI at 71.91 shows strong momentum, still short of extreme overbought exhaustion
Immediate resistance sits at $0.040232 and support at $0.020473
Short-term targets range from $0.020 to $0.040 depending on scenario
Thin liquidity and a low holder count of 106 keep volatility risk elevated
Disclaimer
This article is for educational purposes only and does not constitute financial advice. Crypto markets are volatile. Consult your investment advisor before making any investment decision.