A sudden fifty percent swing in a day tends to grab attention fast, and it usually means something is shifting under the surface. Teller Price Prediction: What The Chart Is Hinting At Right N
A sudden fifty percent swing in a day tends to grab attention fast, and it usually means something is shifting under the surface.
Teller Price Prediction: What The Chart Is Hinting At Right Now
A Teller price prediction matters more this week than it did a month ago, because the token just went from quiet to loud in a matter of hours. Traders scrolling throughmemecoin crypto news started flagging the move before most charts caught up. Something changed.
Volume spiked, new wallets showed up, and social chatter followed. But speed alone doesn't confirm a trend, and that's the tension worth sitting with here. Is this the start of a longer run or a sharp reaction that fades once the excitement cools? The sections below walk through the levels, the supply risk, and the scenarios that matter before deciding either way.
Above The Fold: What Is DEBIT Doing Right Now?
Data snapshot taken at 10:00 UTC on September 14, 2026, sourced from live market trackers.
Metric
Value
Current Price
$3.21
24H Change
+54.69%
Market Cap
$55.41M
Volume (24H)
$1.02B
Trend
Bullish
RSI (4H)
63.02
Key Support
$1.60 – $2.07
Key Resistance
$4.29 – $4.34
Next Target
$5.83
Invalidation
Trading back below $2.07
Teller Price Prediction: Quick Outlook
$DEBIT is trading near $3.21 as of the snapshot above, sitting well above its fifty-period moving average of $2.15. The short-term bias leans bullish, and the next resistance zone sits between $4.29 and $4.34, the same region as the token's all-time high. Support holds near $1.60 to $2.07 for now. Nothing guaranteed there.
Turns out, the 2026 outlook depends heavily on whether trading volume keeps pace with price. A move without volume behind it rarely lasts.
Teller Price Prediction Summary
Timeframe
Bias
Watch Level
Short-term (days)
Bullish
$4.34 resistance
Mid-term (weeks)
Neutral to Bullish
$2.07 support
2026 outlook
Cautiously bullish
Unlock schedule
Teller Technical Analysis
DEBIT Trend Analysis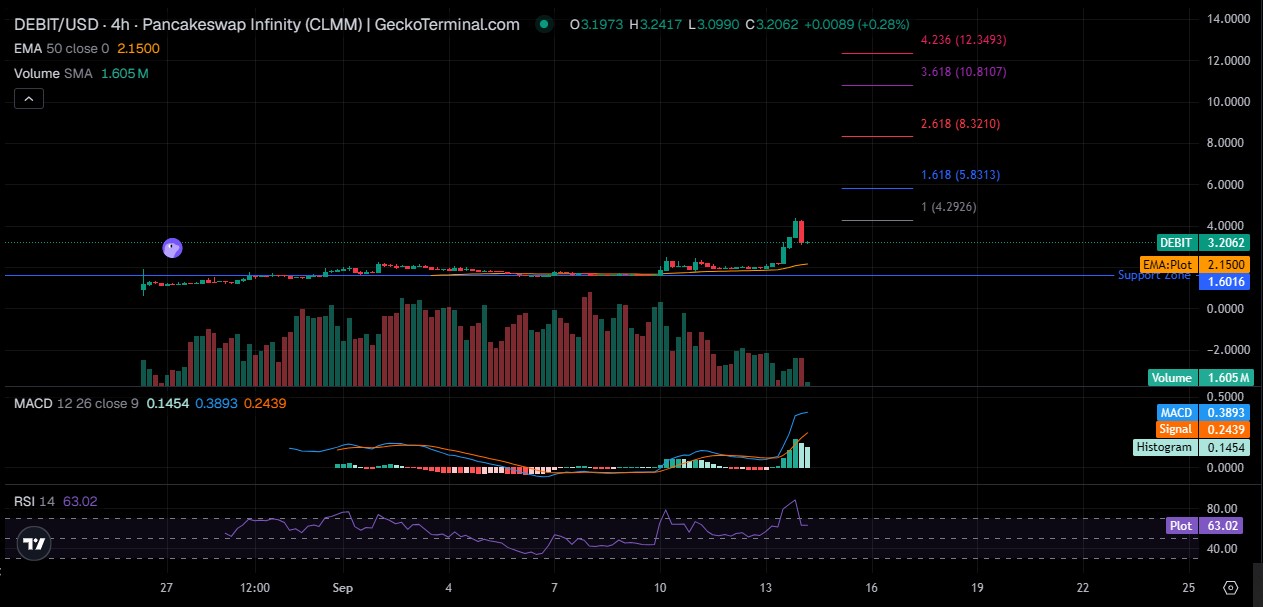
The four-hour chart shows a series of higher highs and higher lows since early September. The price trades above its fifty EMA, and the short-term trendline points upward. But one strong candle doesn't rewrite the whole structure.
DEBIT Support Levels
Two zones stand out: $1.60, tied to the marked support band, and $2.07, the recent 24-hour low. A break below either would shift the near-term picture.
DEBIT Resistance Levels
Immediate resistance sits at $4.29, right under the all-time high of $4.34 set on September 14, 2026. A breakout above that opens the Fibonacci extension at $5.83.
RSI Analysis
RSI on the four-hour chart reads 63.02. That's not overbought yet. RSI above 70 can signal overheated momentum, but strong trends often stay elevated for extended stretches without reversing immediately.
MACD Analysis
The MACD line sits at 0.3893, above its signal line at 0.2439, with a positive histogram of 0.1454. That's a bullish crossover. A flip below the signal line, or a shrinking histogram, would hint at fading momentum.
Volume Analysis
This move is backed by real trading activity. 24-hour volume near $1.02B against a $55.41M market cap is an unusually high ratio. When the team pulled up the volume bars onGeckoTerminal's live chart, the surge lined up directly with the price spike. Price and volume moving together. That's confirmation, not a lone wick.
Teller (DEBIT) Price Prediction 2026
Bull Case
A trading close above $4.34 with rising volume would confirm a breakout. Add an exchange listing catalyst or fresh Debit AI adoption news, and a push toward the $5.83 to $8.32 Fibonacci extension zone becomes realistic.
Base Case
And if momentum simply cools without breaking down, $DEBIT likely consolidates between $2.07 and $4.00. Normal market growth, not fireworks.
Bear Case
Support failure below $1.60 would open the door to a deeper slide. Liquidity thinning out, combined with wider market weakness, could drag $DEBIT back toward its low-single-digit range. Basically, the bear case hinges on volume drying up.
Teller Price Prediction 2027–2030
Year
Bear Case
Base Case
Bull Case
Key Driver
2026
$1.50
$3.50
$8.32
Breakout confirmation and volume follow-through
2027
$1.20
$4.80
$10.81
Debit AI adoption and ecosystem growth
2028
$1.00
$6.20
$12.35
Exchange listings and liquidity expansion
2029
$0.90
$7.60
$15.00
Supply unlocks absorbed by rising demand
2030
$0.80
$9.00
$18.00
Broader altcoin cycle strength and full float
These figures are not guaranteed prices. They depend on adoption, supply unlocks, and the broader crypto cycle.
$DEBIT Breakout Analysis
Bullish Breakout Confirmation
A genuine breakout needs a trading period ending above $4.34, not just a brief poke through it. Add rising volume and follow-through candles the next session, and the setup strengthens.
False Breakout Risk
And if a price wicks above $4.34 on thin volume, then it gets rejected back under it; that's a warning sign. Loss of the breakout level fast usually means the move was speculative, not structural.
Teller Tokenomics and Supply Risk
This section carries real weight for anyone holding past the short term.
Circulating supply sits near 17.22M DEBIT, out of a fixed total and max supply of 100M. That means only about seventeen percent of all tokens are currently unlocked. The remaining 82.78% stays locked under a vesting schedule, according to the project's owntokenomics breakdown.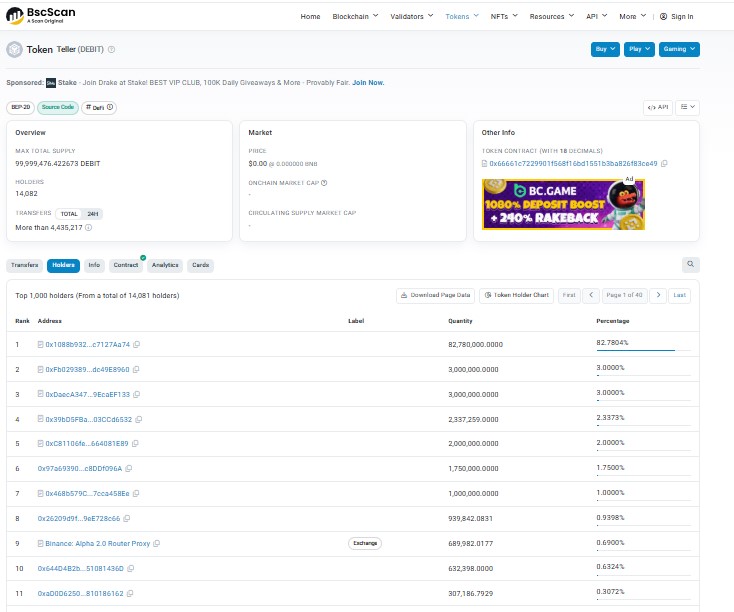
Fully diluted valuation runs near $321.81M, against a live market cap of $55.41M. Interestingly, on-chain holder data fromBscScan's token page shows one address holding roughly 82.78% of supply, a figure that matches the locked-token total almost exactly.
That points to a vesting contract, not a single whale sitting on a dump button. Still, unlock events over the next 12 to 48 months will add supply gradually. Dilution risk is real, even if it isn't immediate.
What Could Drive Teller Price Higher?
Debit AI Adoption
CoinMarketCap's own analysis names Debit AI adoption as a long-term demand driver, since agents built on the platform consume $DEBIT to function.
Teller Ecosystem Growth
New collateral assets recently went live on the platform, expanding what holders can actually do with the token beyond speculation.
Exchange Listings
DEBIT went live on Bithumb's KRW market this month, adding fresh trading pairs and reach. Broadercrypto exchange listing activity tends to widen access and, sometimes, demand.
Liquidity Expansion
Liquidity to market cap sits near 4.60%, a figure worth watching as trading volume grows.
Broader Altcoin Market Strength
And a strong altcoin market generally lifts smaller-cap tokens alongside majors. DEBIT is not immune to that tide either way.
What Could Push DEBIT Lower?
Token unlocks add fresh supply on a schedule, and that supply has to find buyers. Low liquidity relative to volume can worsen slippage on the way down. Profit-taking after a fifty percent daily gain is common, not rare. BTC weakness tends to drag altcoins with it.
A failed breakout at $4.34 would likely trigger quick selling. Declining volume after a spike often signals exhaustion. Speculative sentiment can flip fast. And regulatory or security concerns around any BEP-20 token remain a background risk worth tracking through thecoin events calendar.
$DEBIT Market Cap Scenarios
Using the formula Price = Market Cap ÷ Circulating Supply, and roughly 17.22M DEBIT in circulation as the reference point:
DEBIT Price
Approx. Market Cap*
$2
~$34M
$3
~$52M
$5
~$86M
$10
~$172M
*Based on current circulating supply. Future unlocks will raise circulating supply, which changes these figures even if the price stays flat. Saying "DEBIT can reach $10" means little without knowing how many tokens exist by then.
Teller Price Prediction: Bull, Base, and Bear Scenarios
Bull Case needs a confirmed breakout, rising volume, ecosystem growth, a strong altcoin market, and sustained demand all lining up together.
Base Case assumes moderate adoption, sideways consolidation, and otherwise normal crypto market conditions.
Bear Case involves a support breakdown, supply pressure from unlocks, weak liquidity, a BTC correction, and fading demand.
DEBIT Invalidation Levels
Thesis
Confirmation
Invalidation
Bullish
Trading close above $4.34 with rising volume
Trading back below the breakout level
Neutral
Price holds the $1.60–$2.07 zone
Support breakdown below $1.60
Bearish
Lower highs with support loss
Reclaim of $4.34 resistance
Levels above reflect the current chart structure and will shift as new data comes in.
Breaking: Listings And Momentum Line Up
Bithumb added DEBIT to its KRW market on September 10, 2026. Binance Wallet's Alpha trading competition for $DEBIT ran the same week, perTeller's own announcement. Price moved fast right after. Correlation isn't proof. But the timing lines up too closely to ignore.
Disclaimer
This article is for informational purposes only and does not constitute financial, investment, or trading advice. Cryptocurrency markets, including tokens like DEBIT, are highly volatile and speculative. Price levels, targets, and scenarios discussed above are based on available chart data and public tokenomics information at the time of writing and can change without notice.