A tiny food-themed token just turned into one of the loudest tickers on crypto Twitter. TENDIES went from a few tenths of a cent to over a cent and a half in a single day, and traders who cau
A tiny food-themed token just turned into one of the loudest tickers on crypto Twitter. TENDIES went from a few tenths of a cent to over a cent and a half in a single day, and traders who caught it early are posting screenshots instead of sleeping. The chart looks almost vertical. The volume looks real. But the liquidity behind it tells a very different story, and that gap is exactly what this piece digs into.
Why Is the $TENDIES Price Surging Over 300% Right Now?
TENDIES price prediction interest has spiked fast this week as the memecoin ripped more than 300% in 24 hours. It launched on the Robinhood Chain ecosystem through the Yoink launchpad, and it's been riding a wave of community posts, a Robinhood Crypto wallet shoutout, and a coordinated push from smaller crypto accounts.
The coin sits in the top memecoin category; it has no utility claim beyond being a meme, and its entire value case right now is attention. That's not automatically bad. Plenty of memecoins have run hard on attention alone.
But attention-driven rallies also unwind fast, and the chart structure here already shows overheated conditions. So the real question isn't whether TENDIES can go higher in the next few hours. It's whether there's anything underneath the move that can hold the price once the initial buying wave slows down.
Key Takeaways
Direction:Short-term momentum is bullish but stretched, with the token trading in an ascending channel.
Why:A viral push from Robinhood Chain-adjacent accounts and a Robinhood Wallet feature drove a volume spike.
Short-term range: Roughly $0.006 to $0.018 over the next one to four weeks, depending on whether momentum holds.
Invalidation: A close below $0.0004 would break the current structure entirely.
Coin OverviewMetricValueCoin NameTendiesTickerTENDIESBlockchainRobinhood Chain (Uniswap V3 Pool)Today High$0.01715Today Low$0.002703RSI Level80.42Token TypeMeme TokenToken CategoryMemeMarket CapApproximately $17.0M24H VolumeApproximately $10.7MCirculating Supply1,000,000,000 TENDIESMax Supply1,000,000,000 TENDIES (Fully Circulating)24H Change+303.1%
As of July 16, 2026. Data pulled from CoinGecko and GeckoTerminal. Worth flagging: a separate DEX aggregator listing the same pool shows a market cap closer to $13.8M and 24h volume near $5.3M, a spread you'll see often when comparingsmaller altcoin exchanges for a coin this thin. It's a signal on its own, not just noise.
Coin Background
"Tendies" is a meme token built around a fried chicken tender mascot, trading on the Robinhood Chain ecosystem. It's roughly 16 days old.
Price History and Performance
TENDIES has been a rollercoaster since launch. Its all-time low of $0.002205 came just three days ago, on July 12. Its all-time high of $0.01715 was set within the last few minutes of this writing. That's a move of over 670% in under a week. Most of that came in the last 24 hours alone, when the token jumped over 300% as buying volume surged.
Why This Coin Matters Now
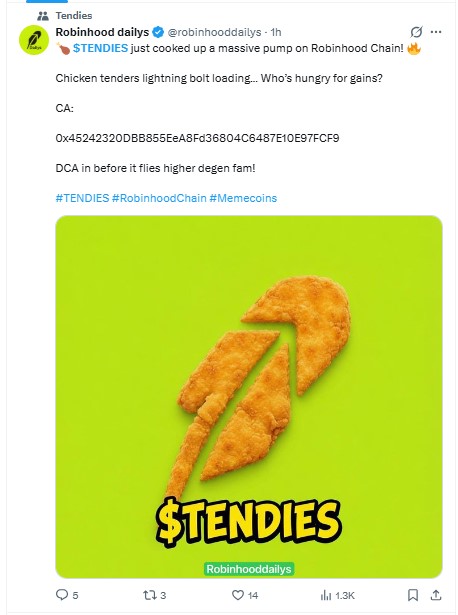
TENDIES matters right now mostly because of where it's trading, not what it does. It sits on the Robinhood Chain, and it got a direct nod from the official Robinhood Crypto account, showing it trending inside the Robinhood Wallet interface.
Source: Posted on X @robinhooddailys
That kind of visibility is rare for anew token launch this young. On top of that, smaller accounts have been actively promoting it, including one post claiming the token's contract address had been independently verified after community concerns about unverified contracts on similar launches.
That claim came from a community member, not an official audit, so treat it as color rather than confirmation. Holder count has grown steadily too, passing 4,200 wallets, which at least shows the rally isn't limited to a handful of bots.
Fundamental Analysis
There's no traditional tokenomics unlock schedule here since all 1 billion tokens are already circulating. That removes one common risk (sudden unlock dumps), but it also means every seller today is an early holder taking profit, not a team or investor unlocking new supply.
As per the Robinhood ecosystem, holder distribution shows the top 10 wallets control 18.14% of the supply, the next 20 wallets hold 19.71%, and the remaining nearly half of the supply is spread across thousands of smaller holders.
That's a moderately concentrated setup, similar to what you'll find across most low-capaltcoin projects this early. Not as dangerous as a handful of whales owning everything, but concentrated enough that a coordinated exit from the top holders could hit the price hard.
Technical Price Analysis
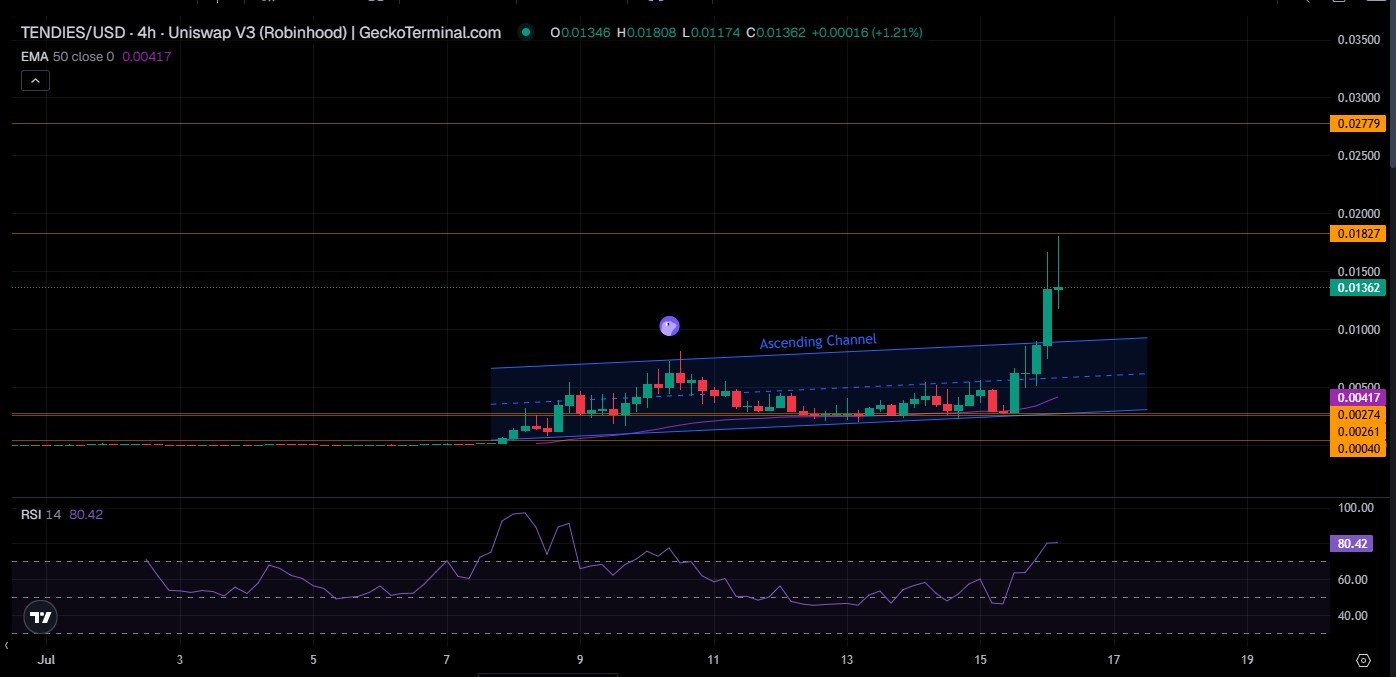
TENDIES is climbing inside a clean ascending channel on the 4-hour chart, and the move has been driven by a straightforward supply and demand squeeze: thin liquidity meeting a fresh wave of buyers.
Source: Charting by GeckoTerminal
That's the cause. The chart is the effect. The price is trading at $0.01362, sitting far above its 50 EMA of $0.00417, which confirms buyers are firmly in control for now. RSI sits at 80.42.
That's stretched and worth weighing against broader sentiment on theFear and Greed Index too. It doesn't mean an immediate reversal, but it does mean the easy gains have likely already happened.
Immediate support sits at $0.00274, with a deeper shelf at $0.00261.
Resistance stacks up at $0.01827 first, then $0.02779. A volume backed close above $0.01827 opens the door toward that higher zone. A rejection there could trigger short-term profit-taking back toward the channel's midline.
Comparison vs Other Coins
TENDIES isn't the only Robinhood Chain memecoin making noise this month. NOXA, another token on the same ecosystem, went through its own scare when its contract sat unverified, and traders worried about what that blank verification meant.
TENDIES avoided that specific issue after a community member said the contract got verified early, but the underlying lesson applies to both: new launchpad tokens on this chain are trading almost entirely on trust and momentum, not on any track record.
Short-Term Price Prediction
Momentum favors more upside in the next few days, but an RSI above 80 means pullbacks should be expected along the way.
TimeframeBearishBaseBullishKey Trigger24 Hours$0.009$0.0136$0.0165Whether buyers defend the $0.011 to $0.012 zone3-7 Days$0.006$0.011$0.018A volume backed close above $0.01827 resistance2-4 Weeks$0.003$0.008$0.014Whether new holder growth keeps pace with early sellers
These ranges are built from the current channel structure, the $0.00274 support and $0.01827/$0.02779 resistance zones, and how RSI has cooled off after similar overbought readings on comparable low-cap launches. Watch the $0.00274 level closely. It's the line between "healthy pullback" and "trend break."
Long-Term Price PredictionTimeframeBearishBaseBullishCatalyst Needed3 Months$0.0015$0.006$0.015Sustained listing visibility inside Robinhood Wallet6 Months$0.0008$0.004$0.02New exchange listings beyond the current DEX poolEnd of 2026$0.0005$0.003$0.025Broader Robinhood Chain ecosystem adoption2027 OutlookNear zero$0.002$0.03+The coin surviving as a recognized meme brand at all
In the long term, the honest take is a weak one. Most tokens that post a 670 % weekly move this early in their life don't hold those gains a year out. TENDIES would need sustained platform backing, not just a single viral tweet, to justify the bullish column.
Three Price Scenarios
Worst Case:Hype fades within days, top holders exit, and thin liquidity accelerates the drop. Triggers a fall back toward $0.001 to $0.003.
Base Case:Price consolidates in a wide range as early profit takers sell into new buyers. Holds roughly $0.005 to $0.012 over the coming weeks.
Best Case:Robinhood Wallet visibility keeps pulling in new holders faster than early buyers can exit. Pushes price through $0.018 and toward $0.028.
ScenarioPrice RangeWhat Triggers ItWorst Case$0.001 - $0.003Whale exit combined with thin liquidityBase Case$0.005 - $0.012Choppy consolidation, no fresh catalystBest Case$0.018 - $0.028Continued viral visibility and new exchange interestKey Price Levels to Watch
Resistance Zone:$0.01827 first, then $0.02779. A close above the first level on strong volume is what would confirm continuation.
Support Zone:$0.00274, backed by a secondary shelf at $0.00261. This is where dip buyers have shown up before.
Invalidation Zone:$0.0004. A close below this level would break the entire bullish structure built since launch.
Risk Factors
Liquidity risk: Pool liquidity sits near $638,600 against a market cap north of $13M. Any sizable sell order can move the price far more than the headline market cap suggests.
Volatility risk:This is a 16-day-old token with a fully diluted valuation under $20M. Swings of 50% or more in a single session are realistic, in both directions.
What breaks the thesis:A coordinated exit from the top 10 wallets (currently holding 18.14% of the supply), a loss of visibility inside Robinhood Wallet, or a broader memecoin market pullback would all undercut the bullish case fast. Keep an eye on thecrypto events calendar too, since there's no scheduled catalyst confirmed for TENDIES beyond its current social momentum.
Analyst View and Final Thoughts
TENDIES is a momentum story right now, not a fundamentals story. The chart setup is genuinely bullish. A price above the 50 EMA, an ascending channel, and real buy volume all point in the same direction.
But RSI at 80.42 is a warning light, not a green light. Overbought conditions this extreme usually resolve with a cooldown before any further climb, especially if thebroader crypto rally driving risk appetite loses steam.
A weekly close above $0.01827 on strong volume would be the clearest signal that this run has more room. Anything less, and a retest of the $0.005 to $0.008 zone wouldn't be surprising.
The one external factor worth tracking is Robinhood Wallet visibility. That single feature placement is arguably doing more for this token's price than anything on-chain.
The most important level on the board is $0.00274. Lose it, and the entire "early Robinhood Chain winner" narrative starts to look shaky.
Turns out the loudest charts and the safest charts are rarely the same chart. $TENDIES is currently both loud and thin, and that combination cuts both ways.
For now, this reads as a high-risk, high-reward momentum trade rather than a long-term holding. Treat it accordingly.
Key Takeaways
TENDIES is up over 300% in 24 hours, trading inside an ascending channel with RSI at an overbought 80.42.
Pool liquidity of roughly $638,600 is thin relative to its market cap, meaning price can move sharply on relatively small orders.
Support sits at $0.00274, resistance at $0.01827 and $0.02779, with $0.0004 as the level that would invalidate the bullish structure.
The rally is being driven largely by visibility inside Robinhood Wallet and social promotion, not by any disclosed utility or roadmap.
Disclaimer
This article is for educational purposes only and does not constitute financial advice. Crypto markets are volatile. Consult your investment advisor before making any investment decision.