ANSEM, also known as The Black Bull, is a memecoin project built around crypto analyst and commentator Ansem, trading across major exchanges, including KuCoin. The Black Bull is the project b
ANSEM, also known as The Black Bull, is a memecoin project built around crypto analyst and commentator Ansem, trading across major exchanges, including KuCoin.
The Black Bull is the project behind ANSEM, and this The Black Bull Price Prediction looks at whether the recent breakout above its ascending trendline holds over the next one to two weeks, a bullish case that stays intact above $0.1780, while a break below that level would put the breakout back in question.
Here's what the chart and derivatives data show.
The Black Bull Price Prediction Today: Market Overview
Metric
Value
Price
$0.1858
Market Cap
$77.18M
FDV
$185M
24h Volume
$12.86M
Vol/Mkt Cap (24h)
16.81%
Liquidity/Mkt Cap
5.90%
Total Supply
999.93M ANSEM
Max Supply
1B $ANSEM
Circulating Supply
417.14M+ $ANSEM
Holders
135.43K
Source: Data from CoinMarketCap as of 4/08/2026. Figures may vary slightly across other tracking websites.
$ANSEM Snapshot: Funding, Open Interest, Volume, and Liquidations
Beyond the chart, derivatives data offers a clearer read on how traders are positioned, starting with the funding rate.
$ANSEM's OI-weighted funding rate has stayed mostly positive over the past few weeks…
Source: Data From CoinGlass
ANSEM Token Forecast: Funding Rate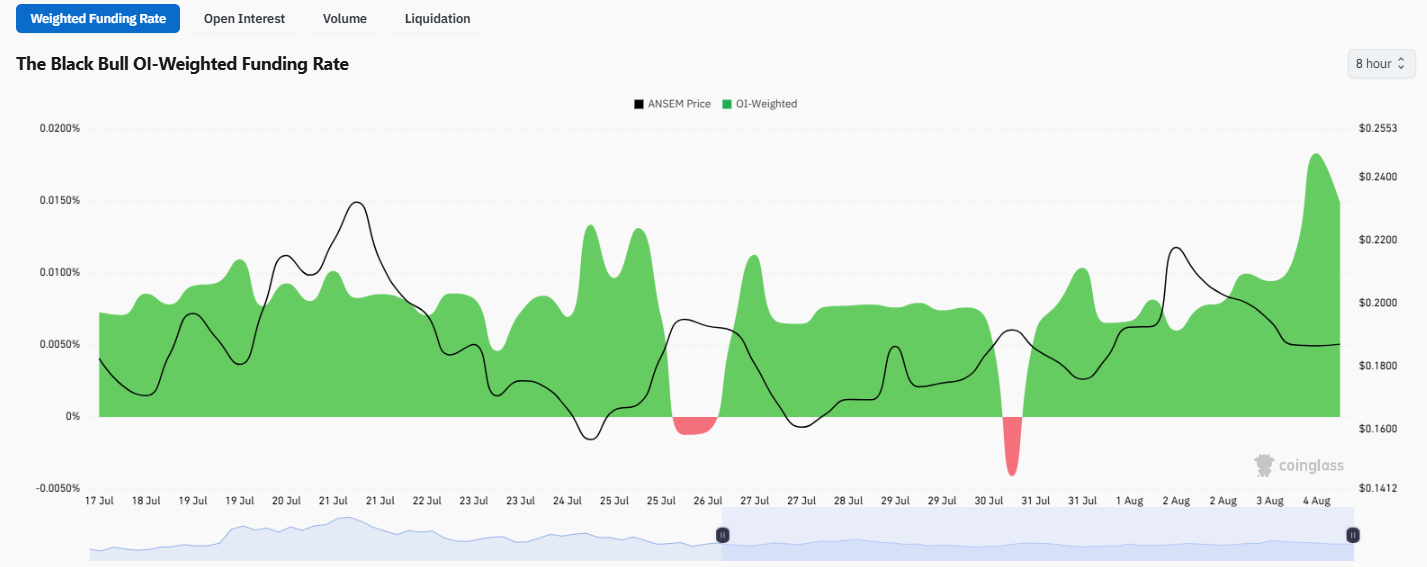
ANSEM's OI-weighted funding rate has stayed mostly positive over the past few weeks, ranging between 0.005% and 0.015%, indicating longs have consistently paid shorts.
Two brief dips into negative funding occurred in late July and around July 30-31, coinciding with short-term pullbacks, before turning sharply positive again into early August as prices rallied.
ANSEM Price Forecast: Open Interest
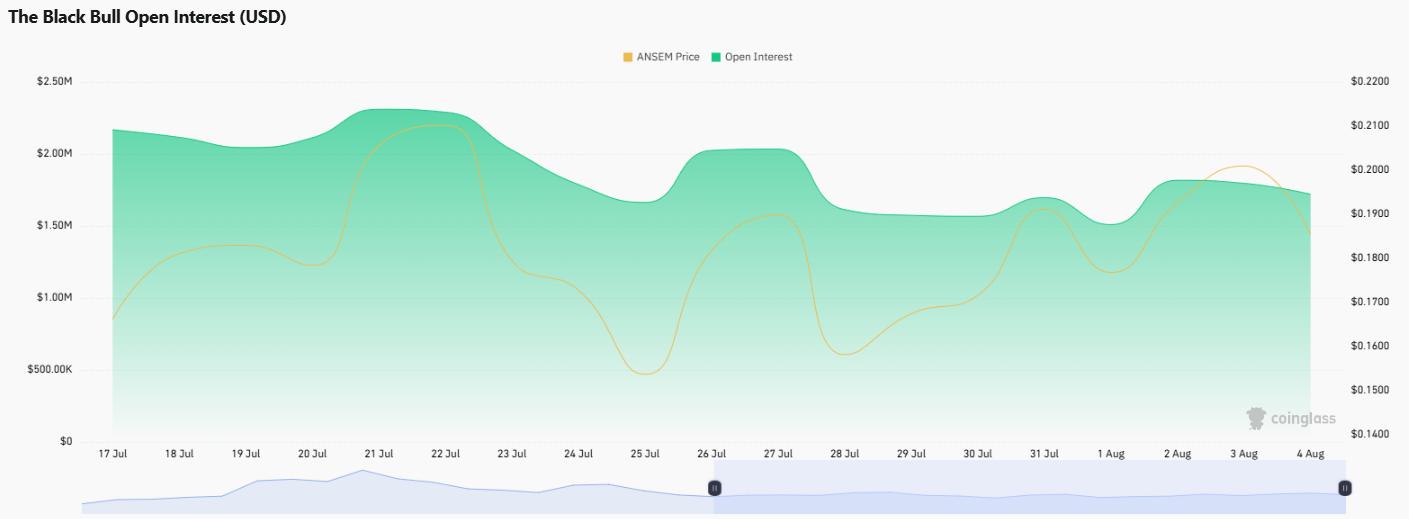
Open interest has fluctuated between roughly $1M and $2.3M, peaking near $2.3M around July 21-22 before declining through late July.
It picked back up in early August, climbing toward $1.8M alongside the recent price bounce, suggesting fresh positioning has entered the market.
ANSEM token forecast: Volume
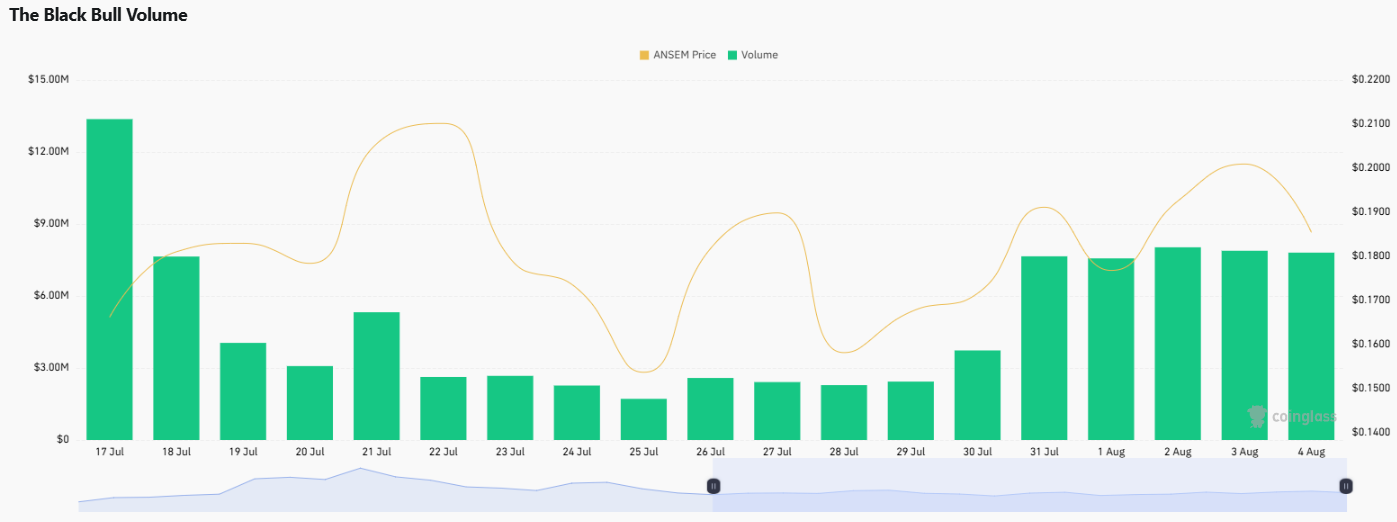
Daily volume spiked to around $13M on July 17 before cooling through the following week, bottoming between $1.5M and $2.9M around July 24-25.
Volume has picked back up since July 31, holding in the $6M to $7M range through early August, tracking the recent recovery.
ANSEM Price Prediction Chart: Technical Analysis
Pair: $ANSEM/USDT · Market: Spot (Crypto) · Exchange: KuCoin · Timeframe: 4H · Source: TradingView · Timestamp: August 4, 2026, 14:28 UTC+5:30
$ANSEM is trading at $0.1858, after breaking above an ascending trendline that has held as support since the July 28 lows.
Price rallied sharply over that trendline, briefly touching the 0.2288 and $0.2096 resistance zones before pulling back, and is now consolidating in a tight range just above the breakout level.
The EMA (Exponential Moving Average, a momentum indicator that weights recent candles more heavily) cluster sits close by, with the shorter EMA at $0.1914 and the longer EMA at $0.1881, both just above the current price, acting as near-term resistance the consolidation still needs to clear.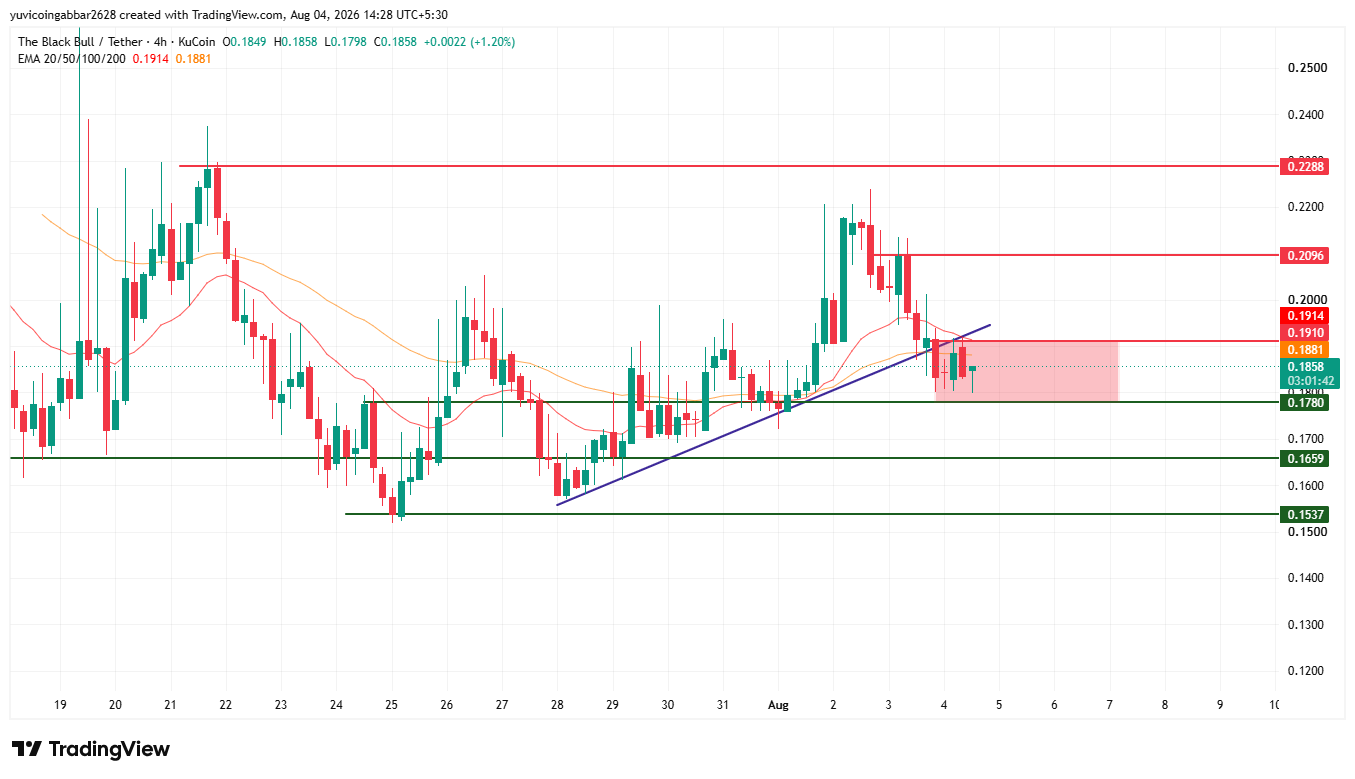
Support and Resistance Levels
Level Type
Price
Resistance 3
$0.2288
Resistance 2
$0.2096
Resistance 1 (nearest)
$0.1910
Immediate Price Reference
$0.1858
First Support
$0.1780
Deeper Support
$0.1659
Structural Floor
$0.1537
EMA Levels
EMA
Price
EMA (20)
$0.1914
EMA (50)
$0.1881
The Black Bull Forecast: Bull Case vs. Bear Case
ANSEM price target 2026 Bull case: Holding above the support zone at $0.1780 and clearing the EMA cluster near $0.1881 to $0.1914 would confirm the breakout is stabilizing rather than fading.
A sustained move above the nearest resistance at $0.1910 would open the path toward $0.2096 and eventually $0.2288.
ANSEM price target 2026 Bear case: A break below $0.1780 would confirm the trendline breakdown, and a lower level like $0.1659 or $0.1537 will come into play as the next downside level.
$ANSEM price target: Can ANSEM Reach $0.2288?
$0.2288 is the highest resistance level marked on the chart. Reaching it would require $ANSEM to first clear the EMA cluster near $0.1881 to $0.1914 and the nearest resistance at $0.1910, then break and hold above $0.2096, a multi-stage move rather than a single leg.
What Could Invalidate the Bullish Setup?
A rejection at the EMA cluster and nearest resistance near $0.1910, followed by a close back below the support zone at $0.1780, would put the breakout in question.
A deeper break below $0.1659 and the structural floor at $0.1537 would undermine the recovery structure entirely.
The Black Bull Price Prediction 2026: Expert View
According to CoinGabbar analysts, the short-term picture: buyers have been in control since late July, and the pullback from the $0.2096 high looks more like a consolidation than a reversal so far.
Open interest and volume both picking up in early August, alongside minimal liquidation activity since mid-July, suggest the current move isn't being driven by leveraged positioning that could unwind quickly.
The $0.1780 to $0.1910 zone is the key battleground: holding it keeps the breakout thesis intact, while losing it would suggest the trendline reclaim was a temporary squeeze.
The Black Bull Price Prediction: Data Sources
Price and EMA data are referenced from a 4H ANSEM/USDT chart via TradingView on KuCoin, timestamped August 4, 2026, 14:28 UTC+5:30.
Market cap, FDV, volume, and supply data referenced from CoinMarketCap.
Funding rate, open interest, volume, and liquidation data referenced from Coinglass.
Disclaimer: This piece is for informational purposes only and isn't financial advice. The levels and scenarios above are based on technical chart analysis and publicly available data at the time of writing, and crypto markets can move sharply within hours, so past patterns don't guarantee future outcomes. It's worth doing independent research and considering your own risk tolerance before acting on any of the levels discussed here.