Three altcoins, Sui (SUI), Aave (AAVE), and Chainlink (LINK), have flashed technical buy signals as cryptocurrency prices recover from their recent declines. Summary Crypto analyst Ali Martin
Three altcoins, Sui (SUI), Aave (AAVE), and Chainlink (LINK), have flashed technical buy signals as cryptocurrency prices recover from their recent declines.
Summary
- Crypto analyst Ali Martinez has identified TD Sequential buy signals for SUI, AAVE, and Chainlink (LINK) on their three-day charts.
- SUI traded near $0.9164, with Martinez watching a possible move toward $1.11 and $1.20 if the recovery continues.
- AAVE recovered above $131, although technical indicators remained bearish as Martinez identified $146 and $176 as possible targets.
- Chainlink traded near $11.16, with resistance around $11.30 standing between LINK and the analyst’s $12.71 target.
- All three altcoins remained below important resistance levels, leaving the buy signals dependent on stronger buying activity.
Crypto analyst Ali Martinez identified the signals on November 4 using the TD Sequential indicator on three-day charts. The indicator looks for signs that an existing price trend may be losing strength, potentially allowing a reversal.
The signals appeared as all three cryptocurrencies attempted to recover from October’s selloff. SUI was trading near $0.92, while AAVE and LINK changed hands around $131 and $11, respectively, per crypto.news market data.
Despite the recovery, their daily charts continued to show selling pressure, leaving analysts focused on the resistance levels that buyers must overcome.
You might also like: These 4 altcoins flash buy signals: Buy the dip?
SUI price targets $1.11 as altcoin flashes buy signal
Sui was trading at $0.92, up over 5% on its daily chart after recovering from a low of $0.86. The token remained below its 20-day Bollinger Bands middle line at $0.95.
Martinez said the three-day TD Sequential had produced a buy signal, suggesting a possible rebound toward higher resistance.
“The level to watch now is $0.90,” Martinez wrote, identifying $1.11 and $1.20 as possible recovery targets.
With SUI already trading above $0.90 in the supplied snapshot, the next challenge lies near $0.95. A sustained move beyond that level would bring $1.00 and the upper Bollinger Band at $1.04 into view.
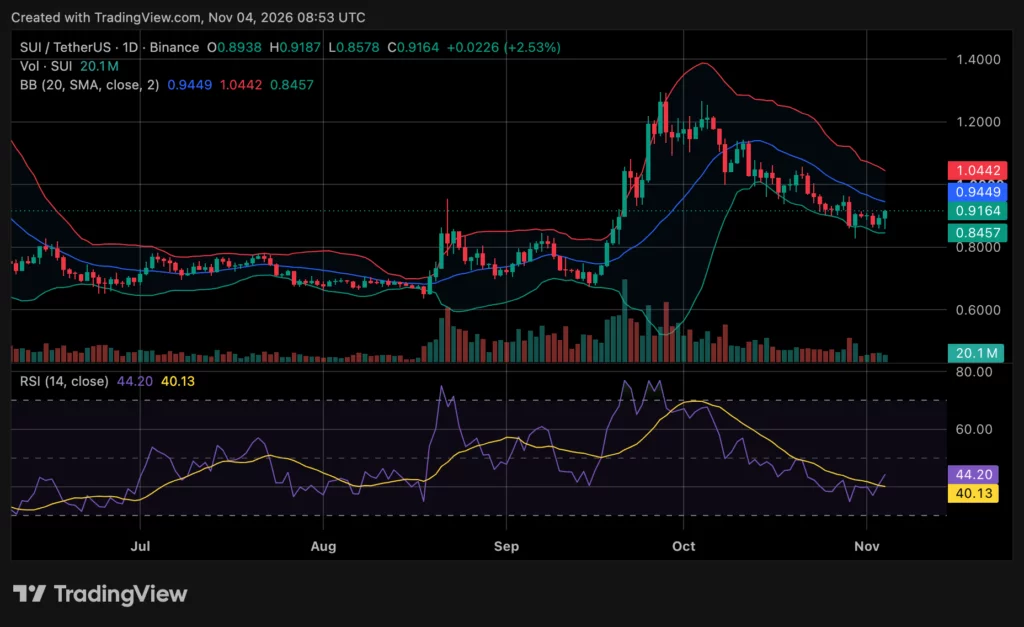
SUI price chart, source: crypto.news
Meanwhile, the Relative Strength Index stood at 44.20, above its moving average of 40.13 but below the neutral 50 level. The reading suggested improving buying interest without confirming a bullish reversal.
Crypto analyst Giannis Andreou identified $0.85–$0.90 as an important support area. He argued that reclaiming $0.98–$1.05 could bring $1.20–$1.30 back into focus.
Earlier, crypto.news examined SUI’s correction when the token traded near $0.99 on October 20. At the time, analysts identified $1.05 as resistance and warned that daily momentum remained weak.
SUI has since moved lower, leaving the November recovery dependent on buyers defending the recent $0.8578 low.
AAVE price faces $146 resistance after TD Sequential buy signal
Aave recovered to approximately $131, gaining over 3% during the daily session after touching $123.
Martinez reported another three-day TD Sequential buy signal and identified $146 as the first potential recovery target.
“If buying pressure picks up, I’m watching for a rebound toward $146,” he said.
The analyst placed the next resistance near $176, where the TD Sequential setup trendline could limit further gains.
His latest assessment followed an earlier October 30 signal. On November 1, Martinez reported that AAVE had already rebounded 16% from that reading, with $155 identified as a possible target.
The daily chart offered a more cautious picture. AAVE remained below its 20-day moving average of $139 and 50-day average of $150.
The 100-day average at $130 provided nearby support, while the Aroon Oscillator stood at -64.29, indicating that bearish momentum continued.
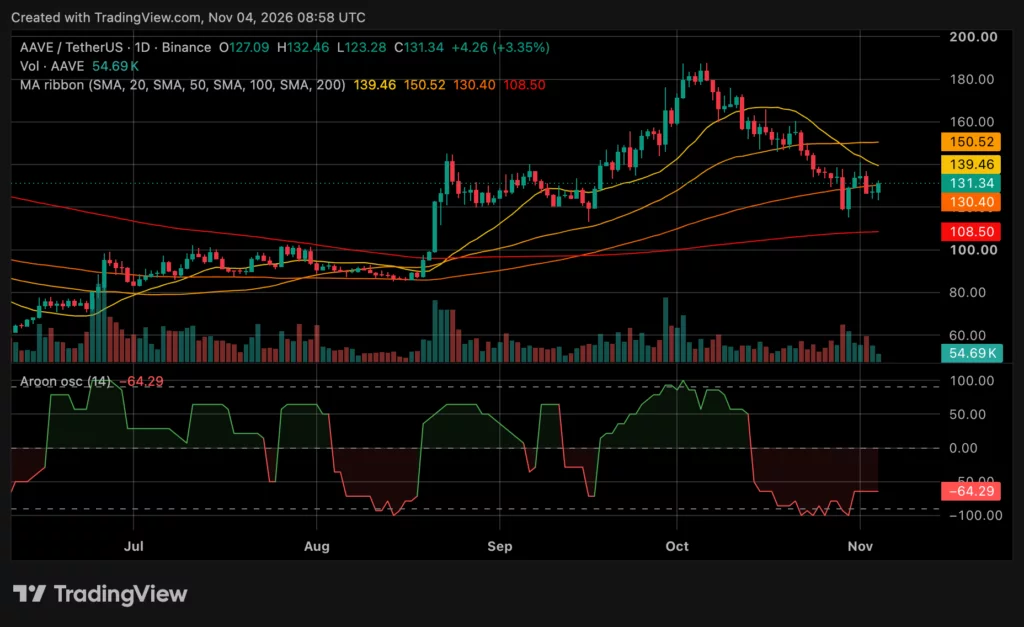
AAVE price chart, source: crypto.news
AAVE would need to reclaim $139 before approaching Martinez’s $146 target. Losing $130 could instead bring $120 back into focus.
Separately, Aave recently adopted Chainlink’s pricing service for tokenized stock collateral on Horizon, allowing valuations during weekends and market holidays.
Chainlink price eyes $12.71 as LINK approaches key resistance
Chainlink traded around $11, recovering from a session low near $10.6 but remaining below its shorter-term moving averages.
Martinez identified $11.30 as the resistance level to watch after LINK produced its own three-day TD Sequential buy signal.
“Breaking past it could trigger a move toward $12.71,” the analyst wrote, with the setup resistance trendline near $14 providing another potential target.
The daily chart showed the nine-day moving average at $11.31 and the 21-day average at $11.70. LINK remained beneath both levels, with the shorter average below the longer one.
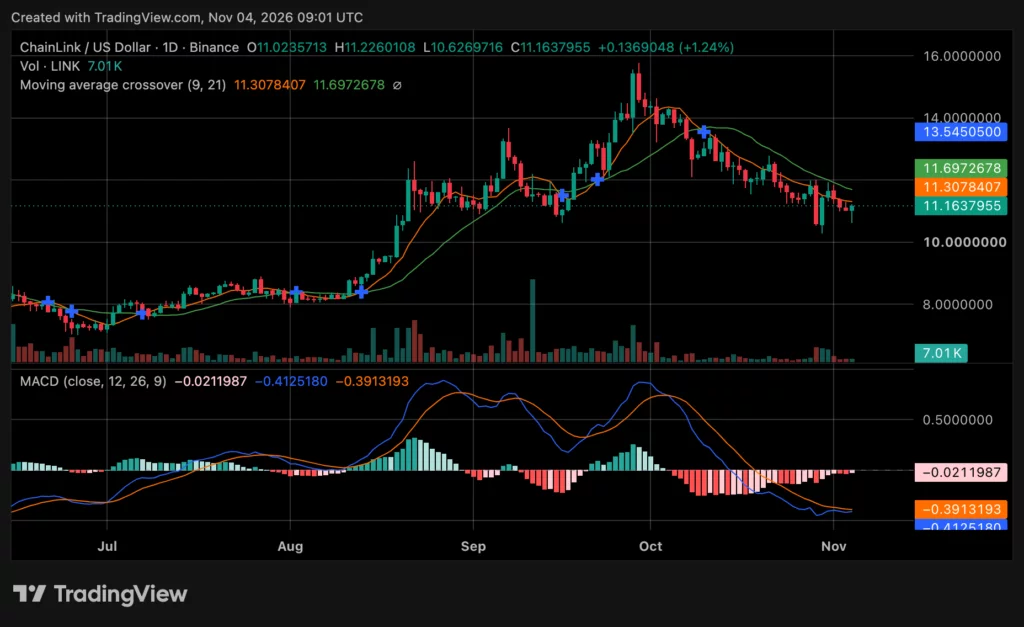
Chainlink (LINK) price chart, source: crypto.news
Its MACD reading was negative at -0.4125, against a signal line of -0.3913. The histogram stood at -0.0212, although shortening negative bars suggested that selling pressure was easing.
Michaël van de Poppe offered a more optimistic longer-term prediction on November 1, suggesting LINK could reach $20 in the first quarter of 2027.
The analyst based his view on a possible recovery from the $10.60 support area following the token’s recent correction.
Chainlink recently launched its 24/7 pricing service for tokenized real-world assets, naming Aave among its adopters.
For the immediate technical outlook, LINK faces resistance at $11.30 and $11.70. Below current prices, the $10.60 area remains the nearest support, followed by $10.00 if selling resumes.
Disclosure: This article does not represent investment advice. The content and materials featured on this page are for educational purposes only.
Read more: Nasdaq on the ledger: XRP’s role in the tokenised equity revolution