Gold just pushed back above $4,000 after that cooler US inflation report gave markets a boost across the board. June CPI came in at 3.5%, under the 3.8% forecast, which eased fears that the F
Gold just pushed back above $4,000 after that cooler US inflation report gave markets a boost across the board.
June CPI came in at 3.5%, under the 3.8% forecast, which eased fears that the Fed would have to keep rates high for a long time. That softer print lifted both risky assets and precious metals, helping gold recover from a steep drop on Monday.
But not everyone thinks this rebound has legs. One chart that’s making the rounds on X argues that this bounce is a trap, just a quick pop before another drop. The analyst who posted it says resistance levels are still acting like a lid on any real recovery. Here’s why that bearish view is picking up steam and what the chart actually shows.
Why This Analyst Thinks the Gold Price Could Fall Further
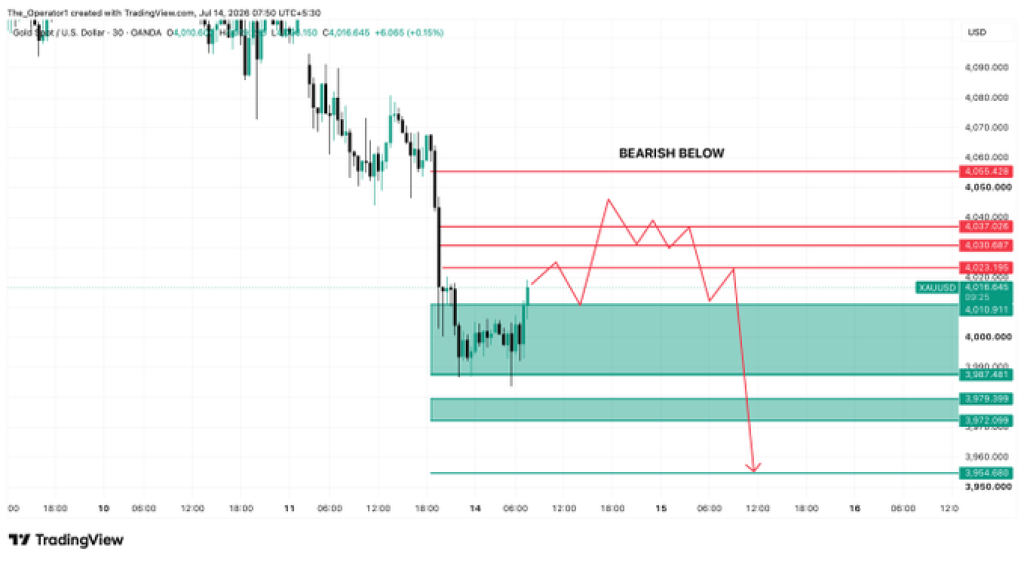
Trader Itsadieefx believes Monday completely changed the short-term outlook for the gold price. His key support zone between $4,093 and $4,116 failed to hold after gold opened below it, turning what had been support into a resistance area.
The analyst argues that many traders who bought near last week’s lows, especially those using $4,000 as their stop-loss, were trapped during the aggressive sell-off. In his view, the market is likely to lure buyers back with a temporary recovery before extending the decline toward the $3,950 support area and potentially lower.
His trading plan is straightforward. As long as the gold price remains below $4,055, he continues looking for selling opportunities on rallies, believing sellers still control the short-term trend.
What the Gold Chart Is Showing
We had a look at the gold chart, and the technical picture closely matches the analyst’s view. Gold climbed back to $4,000 after buyers stepped in around $3,970. But here’s the catch, it’s still stuck under the old support zone between $4,055 and $4,116. That area is now resistance.
Related Gold News: Gold and Silver Price Forecast: Popular Analyst Says Buy the Panic at $3,600 and $50
 Source: X/Itsadieefx
The chart shows a possible pop toward $4,030–$4,040, then another rejection near $4,055. If sellers hold that line again, we could see the gold price retreat back to $4,000. Below that, $3,970 and $3,955 are the next floors. Break those, and we’re looking at $3,955–$3,950, which matches the bearish target floating around.
That bearish view starts to crack if buyers can take back $4,055 and hold it. Then $4,080 comes into play, followed by $4,093, and eventually $4,116. Until then, the chart continues to favor rallies into resistance instead of an immediate breakout.
Peter Schiff weighed in before the inflation numbers even dropped. He pointed out that the gold price had fallen under $4,000, Treasury yields were climbing, tensions with Iran were heating up, and everyone was bracing for Fed Chair Kevin Warsh’s testimony to Congress. His take? Any hawkish talk from the Fed could end up supporting gold down the road.
Then the CPI report hit, and everything flipped. Cooler inflation lifted crypto and precious metals together, pushing gold back over $4,000 as traders started betting on easier policy from the Fed.
For now, that inflation data gave buyers some room to breathe. But the real fight is still at $4,055. Break above that, and the bearish case starts to crumble. Get rejected there again, and we could be looking at a drop back toward $3,950 before any real recovery takes hold.
Frequently Asked Questions
Why is the gold price back above $4,000?
The gold price rebounded after June’s U.S. CPI came in at 3.5%, below the expected 3.8%, boosting expectations for lower interest rates. Softer inflation increased demand for precious metals and helped gold recover above the $4,000 level.
Why does the analyst expect the gold price to fallThe analyst believes the former support zone between $4,093 and $4,116 has turned into strong resistance after Monday’s gap lower. As long as the gold price remains below $4,055, he expects rallies to attract sellers before another move toward $3,950.
What levels should traders watch for the gold priceThe key resistance levels are $4,055, $4,080, and $4,093, where buyers need to regain control to strengthen the recovery. On the downside, $4,000, $3,970, and $3,950 remain the most important support levels to monitor.
Subscribe to our YouTube channel for daily crypto updates, market insights, and expert analysis.
The post This Analyst Has A Viral Gold Price Prediction appeared first on CaptainAltcoin.


 GOLD JUST SENT A WARNING… DON'T IGNORE ITYesterday, the market completely invalidated the key support zone that I shared, which was between $4093 and $4116. Instead of respecting that support, Gold opened with a gap-down below the zone. As a result, what was…