By Crypto Markets Analyst. Reviewed by the Crypto Markets Editor. Price data below reflects the most recent cross-checked figures as of late July 2026 (~$0.00067, aggregated from CoinMarketCa
By Crypto Markets Analyst. Reviewed by the Crypto Markets Editor. Price data below reflects the most recent cross-checked figures as of late July 2026 (~$0.00067, aggregated from CoinMarketCap); T6900 trades on thin volume, so verify the live price before acting.
Nearly a year after its Uniswap debut, T6900 is quietly testing new lows even as today's volume just jumped 377% overnight.
That combination, falling price, surging volume, is exactly the kind of signal worth unpacking rather than skimming past in this Token6900 Price Prediction.
TOKEN6900 Price Today: Live Data and 24-Hour Change
T6900 trades at $0.0004519, down 3.15% on the day, against a $398.67K market cap and $420.77K FDV, close together since 882.09 million of the 930.99 million total supply is already circulating.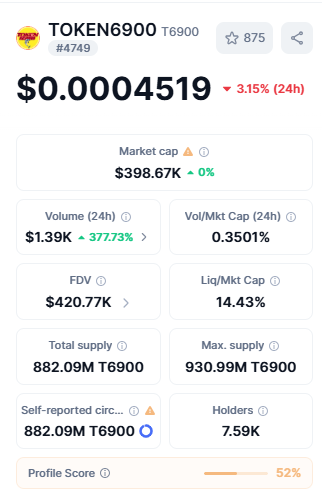
Source: Token6900 Info by CoinMarketCap
The standout figure is volume: $1.39K in the last 24 hours, up 377.73% from the prior day, still small in absolute terms, but a meaningful relative jump worth flagging.
Liquidity-to-market-cap sits at 14.43%, and the tracker's Profile Score reads 52%, a middling reading consistent with a thin, low-conviction market.
TOKEN6900 Price Prediction for August 2026: Bull, Base, and Bear Cases
Scenario
Trigger
T6900 Price Range
Bear
Confirmed break below $0.0004012 support
$0.0002928 - $0.0004012
Base
Continued range-bound trading between chart levels
$0.0004012 - $0.0005985
Bull
Volume surge sustains, reclaim of $0.0005985
$0.0005985 - $0.0007298
Invalidation: the bull case fails on any close back below $0.0004519. The bear case is invalidated by a hold above $0.0004519 for more than two sessions with volume staying elevated.
TOKEN6900 Technical Analysis: Key Support and Resistance Levels
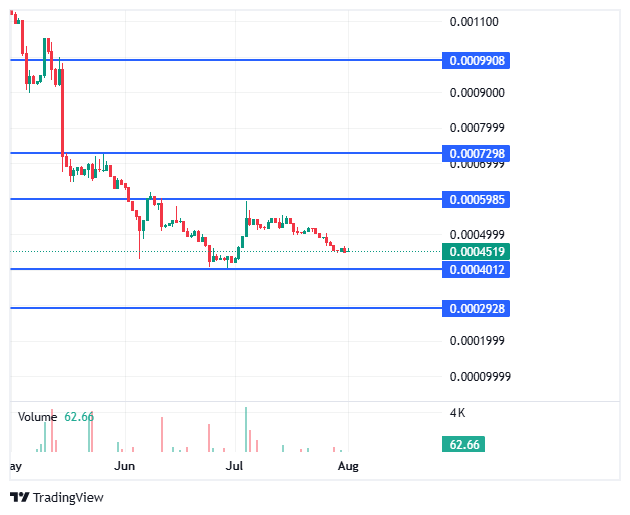
The chart shows four clearly marked levels. Resistance sits at $0.0005985 first, then $0.0007298, and $0.0009908 as the outer ceiling, all three untested since the token's steady decline through May and June.
Source:Token6900 Chart by CoinMarketCap
Support sits at $0.0004012 immediately below the current price, with a deeper floor at $0.0002928 if that first level breaks.
Price currently trades right at $0.0004519, just above the nearest support. Inside a tight consolidation band, it's held since mid-July after failing to sustain a brief bounce toward $0.0006 in early July.
TOKEN6900: On-Chain and Fundamental Drivers
T6900 launched via a claim-and-stake rollout, the "TOKEN6900 Claim and Token now LIVE!" announcement, back when the presale closed having raised $3,635,457.91, shortly before its September 3, 2025 Uniswap listing.
Nearly a year on, that history matters less than current structure: 7,590 holders and a 52% profile score suggest a market that's stabilized into a small, low-volume niche audience rather than one still actively growing or actively collapsing.
August 2026 Catalysts That Could Move TOKEN6900
The clearest near-term signal is today's own volume spike; a 377.73% jump against a falling price is unusual and worth watching over the next few days to see whether it's the start of accumulation or simply a larger seller clearing a position into thin liquidity. No other named catalyst is confirmed for August.
TOKEN6900 Price Prediction: What Analysts Are Forecasting
Original 2025 launch-era coverage projected a $52 million market cap target. T6900's actual market cap today, $398.67K, sits more than 99% below that figure, underscoring how disconnected pre-launch marketing projections were from what actually happened.
TOKEN6900 Long-Term Outlook: 2027 to 2030
A base case assumes T6900 continues trading inside its current $0.0003-$0.0006 band absent a specific catalyst through 2030.
A bull case tied to a genuine broader meme-coin cycle could support a return toward $0.0009-$0.0012, the resistance zone visible on the current chart, though reaching it would require sustained volume well above today's levels.
Risks That Could Invalidate This Forecast
Thin liquidity remains the dominant risk; at 14.43% liquidity-to-market-cap, larger trades can move price sharply.
A second risk is the unexplained gap between total and circulating supply, roughly 49 million T6900 not yet accounted for in daily trading data.
A third: today's volume spike could reverse as quickly as it appeared, a common pattern in thinly traded meme tokens.
How to Buy and Store TOKEN6900 Safely
T6900 trades on Uniswap; verify the contract address through official Token6900 channels before connecting a wallet.
Move holdings to a non-custodial wallet rather than leaving them on any single exchange interface, standard practice for any thinly traded token.
Glossary
Vol/Mkt Cap Ratio: Daily volume as a percentage of market cap; T6900's 0.35% reflects very light trading relative to its size.
Profile Score:A tracker-generated risk indicator; T6900's 52% is a middling, moderate-risk reading.
Self-Reported Circulating Supply: Circulating supply as reported by the project itself, flagged separately from independently verified figures.
Disclaimer
Informational purposes only, not financial advice. All price scenarios are estimates, not guarantees. T6900 trades with thin liquidity, and today's volume spike may not persist. Cryptocurrency carries a significant risk of loss. Verify all data independently before acting.