Key Highlights TOTAL2 trades near $1.07T — compressed inside a falling wedge on the daily chart per @CryptoBullet1 Relief rally expected but capped at the 0.618 Fibonacci level — a B-wave, no
Key Highlights
TOTAL2 trades near $1.07T — compressed inside a falling wedge on the daily chart per @CryptoBullet1
Relief rally expected but capped at the 0.618 Fibonacci level — a B-wave, not a new bull leg
Final C-wave decline forecast to complete by mid-November near the 200-day moving average
CryptoBullet targets a strong altcoin impulse rally in H1 2027 after the higher low is confirmed
The altcoin market capitalization excluding Bitcoin — tracked as TOTAL2 on TradingView — is pressing against the lower boundary of a multi-week falling wedge at approximately $1.07 trillion, as visible on the chart’s current price box. The pattern is one of the most reliable compression structures in technical analysis, and its resolution is now the central question for altcoin traders heading into November.
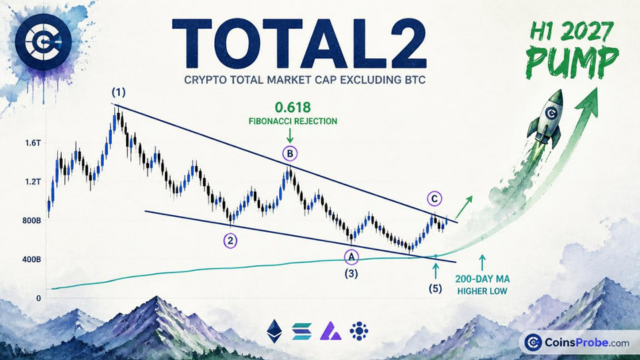
Analyst CryptoBullet (@CryptoBullet1), posting on October 17, 2026, lays out a precise three-stage roadmap: a falling wedge breakout first, then a limited relief rally capped by the 0.618 Fibonacci level, followed by a final Elliott Wave C-wave decline into mid-November — ideally printing a higher low near the 200-day moving average. Only after that structure completes does he anticipate a meaningful pump in H1 2027.
A falling wedge forms when price makes lower highs and lower lows within two converging downward trendlines, compressing volatility until a breakout occurs. It is classified as a bullish reversal or continuation pattern depending on the prior trend context. On the TOTAL2 daily chart, CryptoBullet has drawn this wedge over the recent corrective sequence, with the chart also annotating an ABC corrective structure and a prior five-wave Elliott impulse labeled (1) through (5).
The current TOTAL2 price box on the chart reads approximately $1.07 trillion, sitting near the lower trendline of the wedge. The right-axis labels on the chart show a price ladder ranging from roughly $796.5B at the lower end to $1.48T at the upper end, giving context to the full range of the pattern. The 0.618 Fibonacci level — printed in green on the chart — sits as the ceiling for the anticipated relief move, while the 0.382 level also appears as an intermediate reference. CryptoBullet does not assign specific dollar values to these Fibonacci levels in his post; the chart labels identify them by ratio only.
CryptoBullet’s first call is a breakout above the falling wedge’s upper trendline. Within the Elliott Wave structure annotated on the chart, this breakout corresponds to a B-wave relief rally — a counter-trend bounce within the broader corrective sequence, not the start of a new bull leg.

Chart Analysis | Source: @CryptoBullet1 (X)
The critical constraint he places on this rally: it should not exceed the 0.618 Fibonacci retracement level. In Elliott Wave theory, a B-wave that reclaims more than 61.8% of the prior A-wave decline would invalidate the corrective count and suggest a more immediately bullish impulse is underway. By setting the 0.618 Fib as the hard ceiling, CryptoBullet is signaling that any rally toward — but not through — that level would confirm the corrective interpretation and set up the final leg down.
This framing matters for positioning. A rally that reaches the 0.618 Fib zone is not a buy signal under his thesis — it is the rejection zone. Traders chasing the wedge breakout would need to watch that level as the boundary between the B-wave and a trend change.
Following the 0.618 rejection, CryptoBullet anticipates the final C-wave decline completing by mid-November. In a standard ABC correction, the C-wave is typically impulsive — five sub-waves moving in the direction of the larger correction — and often equals or exceeds the length of the A-wave. This is the leg that tends to shake out late longs and capitulate sentiment before a genuine reversal.
The target zone he identifies for this C-wave low is the 200-day moving average. He describes this as an “ideally” printed higher low — meaning the C-wave trough should hold above the prior significant low, preserving the broader market structure. A higher low at the 200-day MA would be a structurally constructive outcome: it demonstrates that sellers could not push through a major long-term support level, and it sets the foundation for the next impulsive move.
For altcoin portfolio managers, the 200-day MA on TOTAL2 is the level to monitor through November. CryptoBullet does not specify its exact dollar value in his post, and chart axis labels are display boundaries rather than analyst-stated levels — so traders should reference live charting platforms for the current 200-day MA reading on TOTAL2.
For additional context on how similar corrective patterns have played out in individual altcoins, see our earlier analysis on the Chainlink Head-and-Shoulders on 4H Chart — a comparable structure where a breakdown level ($12) defined the entire trade thesis.
The payoff in CryptoBullet’s roadmap is not in November — it is in the first half of 2027. After the higher low is printed near the 200-day MA, he anticipates a strong impulse rally corresponding to Elliott Wave ③ on his chart. Wave three impulses in Elliott theory are typically the longest and strongest, characterized by broad participation and expanding volume. This is the phase where altcoins historically produce their most aggressive percentage gains in a cycle.
The sequencing is deliberate: wedge breakout → capped rally → C-wave flush → higher low → H1 2027 launch. Each step is a precondition for the next. Skipping the C-wave down or failing to hold the 200-day MA would alter the entire structure.
Broader on-chain conditions heading into this setup are also relevant — see the analysis of New Bitcoin Whale Cost Basis Near $77K for the macro accumulation context that underpins altcoin cycles.
Bullish Scenario
TOTAL2 breaks above the falling wedge’s upper trendline, mounts a B-wave rally toward — but not through — the 0.618 Fibonacci level, then completes a C-wave decline that holds above prior lows and finds support at the 200-day MA in November. This sequence confirms the corrective structure and validates the H1 2027 impulse setup. Altcoin market caps would recover from the $1.07T level and begin a sustained expansion.
Bearish Scenario
If TOTAL2 fails to break the falling wedge and instead breaks the lower trendline, the corrective count is invalidated in the other direction — a more direct continuation lower without the relief rally stage. Alternatively, if the C-wave extends below the prior significant low rather than printing a higher low, the higher-low thesis fails and the 200-day MA does not hold as support. Either outcome would push the H1 2027 pump scenario further into the future or require a complete recount.
Developments in individual altcoins are already reflecting this uncertainty — Dogecoin’s three converging buy signals at $0.081 represent the kind of individual asset setups that either confirm or deny the broader TOTAL2 higher-low thesis in real time.
CryptoBullet’s TOTAL2 roadmap is clean in its logic: a falling wedge compression resolves upward into a limited B-wave, the 0.618 Fibonacci level acts as the ceiling and rejection trigger, a final C-wave completes the correction near the 200-day MA by mid-November, and the higher low there becomes the launch pad for a H1 2027 altcoin impulse.
The thesis fails if the C-wave breaks below the prior low rather than printing a higher low, or if a rally through the 0.618 Fib invalidates the corrective count entirely. Watch the 200-day moving average on TOTAL2 throughout November — it is the single level that determines whether this correction ends as a buying opportunity or deepens into something structurally more damaging.
Disclaimer: The views and analysis presented in this article are for informational purposes only and reflect the author’s perspective, not financial advice. Technical patterns and indicators discussed are subject to market volatility and may or may not yield anticipated results. Investors are advised to exercise caution, conduct independent research, and make decisions aligned with their individual risk tolerance.
Also Read: Chainlink Head-and-Shoulders on 4H Chart — $12 Is the Line, $8.50 Is the Target