$TRX is trading around $0.3292 right now, sitting right between two trendlines that have guided its price action for years. Working out where this token could realistically land takes a prope
$TRX is trading around $0.3292 right now, sitting right between two trendlines that have guided its price action for years.
Working out where this token could realistically land takes a proper look at how these trendlines have behaved before making any TRON price prediction 2029 calls.
TRON currently ranks 8th among all cryptocurrencies, holding a market cap close to $31.38 billion and a fully diluted value at the same level, out of a total supply of 94,861,776,021 tokens, with 94,861,764,665 already in circulation.
This TRON coin price prediction leans on that same trendline structure to build out realistic long-term targets.
TRON Price Right Now
Metric
Value
Current Price
$0.3292
Market Cap
$31.38B
24H Volume
$277.53M
Circulating Supply
94,861,764,665 TRX
Total Supply
94,861,776,021 TRX
TRON Chart Structure Right Now
On the monthly chart, TRX has been guided by a trendline that started forming back in March 2023, sitting right under the price and acting like a floor since then.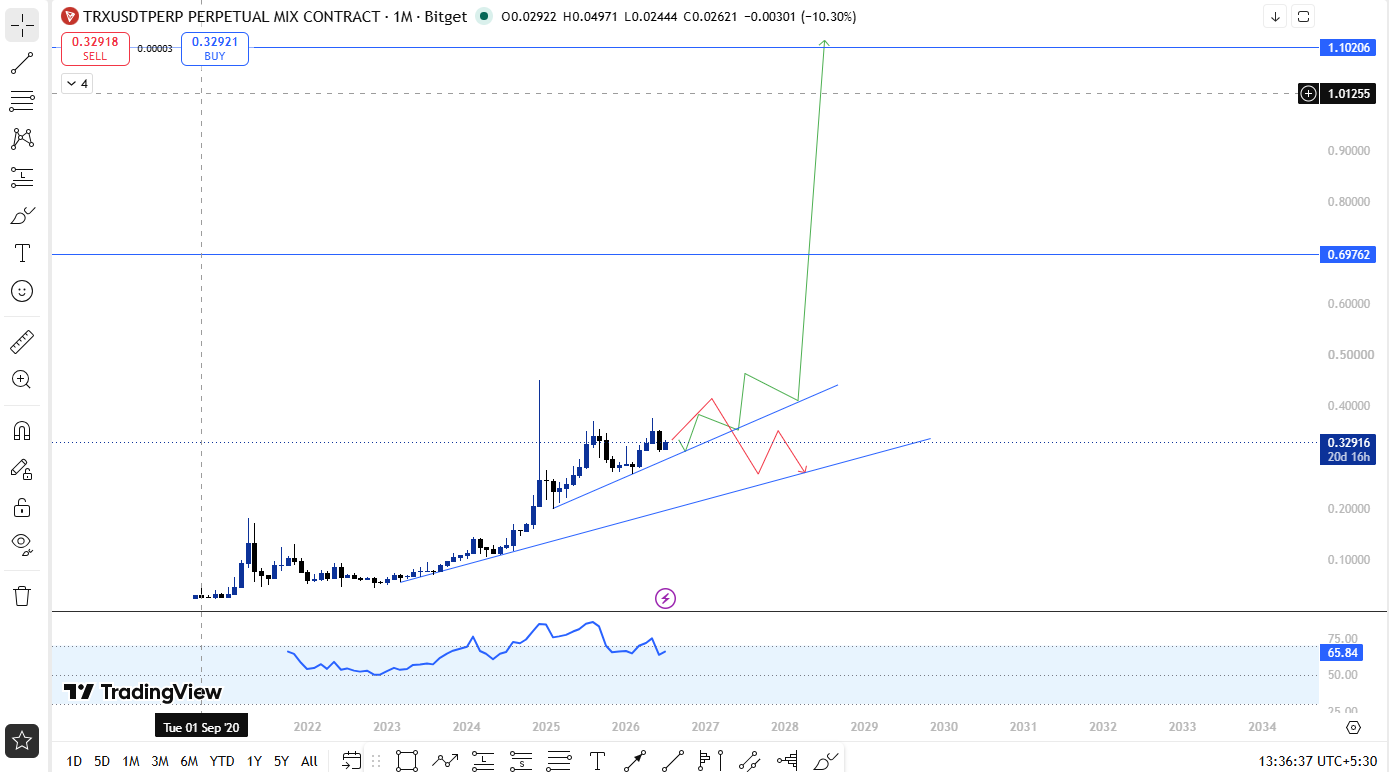
That trendline caught every dip and pushed TRX higher each time price touched it. A few months after it formed, TRX pulled off a huge move, rallying more than 300% straight off that trendline support.
That one rally basically reshaped the whole chart.
Since that rally, TRX has mostly stayed stuck between that same trendline support on the lower end and the highs it made on the upper end.
This TRX technical analysis leans on that exact range, since it has driven price action ever since.
Inside this range, price also carved out a double-top pattern. That usually just means buyers got tired near the highs, not that the trend is over.
After that double top, a new and steeper trendline began forming underneath the price.
This is the trendline currently supporting TRX, sitting a bit higher than the older 2023 one.
Price is currently sitting above both trendlines, working through a small consolidation just under the $0.4 area.
This kind of tightening range inside an already established uptrend is usually a pause rather than a reversal, especially with both trendlines still holding underneath.
The monthly RSI is around 65.84.
What This Setup Means Going Forward
If TRX holds support on this newer trendline, the setup favors another rally kicking off from around the $0.3 area, much like what happened right after the 2023 breakout.
A clean break above the $0.69762 resistance level would then open the door toward the $1.10206 level, which sits just under the psychological $1 mark, a level many are watching closely as they track whether TRX can reach $1.
On the other hand, if this newer trendline fails to hold and price breaks below it, TRX would likely slide back toward the older, main trendline near the $0.25 area.
That main trendline has held up as reliable support since 2023, so a pullback into that zone could still give TRX a fresh base to launch its next upmove from, which would keep the broader uptrend structure intact as long as that main trendline is not broken.
Support and Resistance Levels
The main trendline from 2023 remains the key major support to watch.
In the near term, the newer trendline support sits close to $0.3, and holding there keeps the door open for a fresh push toward the next resistance.
If that support gives way, the main trendline near $0.25 becomes the next real support in play.
On the upside, $0.69762 is the first major resistance, with $1.10206 as the next target once that level clears.
TRON Price Prediction 2029: Targets for the Next Cycle
Timeframe
Scenario
Min Target
Max Target
Key Trigger
2026
Range Defense
$0.25
$0.33
The main trendline support holds
2026
Breakout Attempt
$0.40
$0.55
Early push toward the next resistance
2027
Range Defense
$0.30
$0.45
Trendline support intact, no fresh breakdown
2027
Breakout Attempt
$0.55
$0.69
A weekly close above $0.69762 confirmed
2028
Extension Phase (Bearish)
$0.40
$0.55
Support holds; price grinds higher slowly
2028
Extension Phase (Bullish)
$0.69
$0.90
Momentum builds past $0.69762 resistance
2029
Cycle Peak Zone (Bearish)
$0.50
$0.65
A range-bound structure persists
2029
Cycle Peak Zone (Bullish)
$0.90
$1.10
Full breakout above $1.10206 confirmed
These price projections are not guaranteed and are based on technical analysis, historical trends, and market assumptions. Actual TRON prices may vary significantly.
Risk and Reward: The Honest Version
Factor
Bull Case
Bear Case
Trendline Support
Holds, fuels renewed long-term buying
Breaks down, structure weakens
Key Resistance ($0.69762)
A weekly close above confirms fresh upside
Rejects again, price stays capped
Key Resistance ($1.10206)
Clears on strong volume, opens next leg up
Fails to break; range extends longer
The analysis above combines historical price structure with publicly available market data and should not be treated as a guarantee of future performance.
Invalidation Level
This entire setup depends on both trendlines staying intact.
A break below the newer trendline support near $0.3 would first send TRX toward the main trendline around $0.25. Only a monthly close below that main trendline would fully invalidate the bullish structure, and in that case TRX would likely need to build a new base lower down before any fresh attempt at the $0.69762 to $1.10206 targets becomes realistic.
Is TRON a Good Long-Term Investment
TRX's chart shows a token that has respected its main trendline for years now, using every pullback to that support as a launchpad for the next leg higher.
With price currently consolidating above both trendlines, a breakout above $0.69762 could be the trigger for a serious long-term move.
For anyone looking at a 2029 horizon, this trendline structure remains the key thing to track in this ongoing TRON price forecast.
Expert View
Sentiment around TRX has stayed fairly steady, with several analysts pointing to TRON's consistent transaction volume and stablecoin activity as a reason for long-term confidence in the network.
The current consolidation near resistance is being watched closely, since a breakout here has historically led to strong follow-through moves. Most agree the reaction at the $0.69762 level will be the real test of whether TRX is ready for its next major leg toward $1 and beyond by 2029.
Conclusion
TRX's chart really comes down to one structure right now, the two trendlines that have guided price since 2023.
As long as these trendlines stay intact, the path remains open toward $0.69762 and eventually $1.10206.
How TRX handles this consolidation over the next few months will likely decide whether 2029 brings a serious breakout or more time spent building between these trendlines for this TRON coin forecast.
Disclaimer: This article is for informational purposes only and should not be considered financial advice. Cryptocurrency markets are highly volatile, and price predictions are not guaranteed. Please do your own research before making any investment decisions.