The TRUMP memecoin is making noise again. After weeks of grinding sideways under pressure, the Official Trump token posted back-to-back green days, gaining 3.15% in 24 hours to trade at $1.90
The TRUMP memecoin is making noise again. After weeks of grinding sideways under pressure, the Official Trump token posted back-to-back green days, gaining 3.15% in 24 hours to trade at $1.90 while volume climbed a notable 25% to $281 million. Traders are leaning bullish, derivatives data is flashing confidence, and yet the chart tells a more complicated story. Whether this is the start of a genuine recovery or just another false dawn depends almost entirely on one number: $2.27.
Why the TRUMP Memecoin Price Still Has a Serious Problem
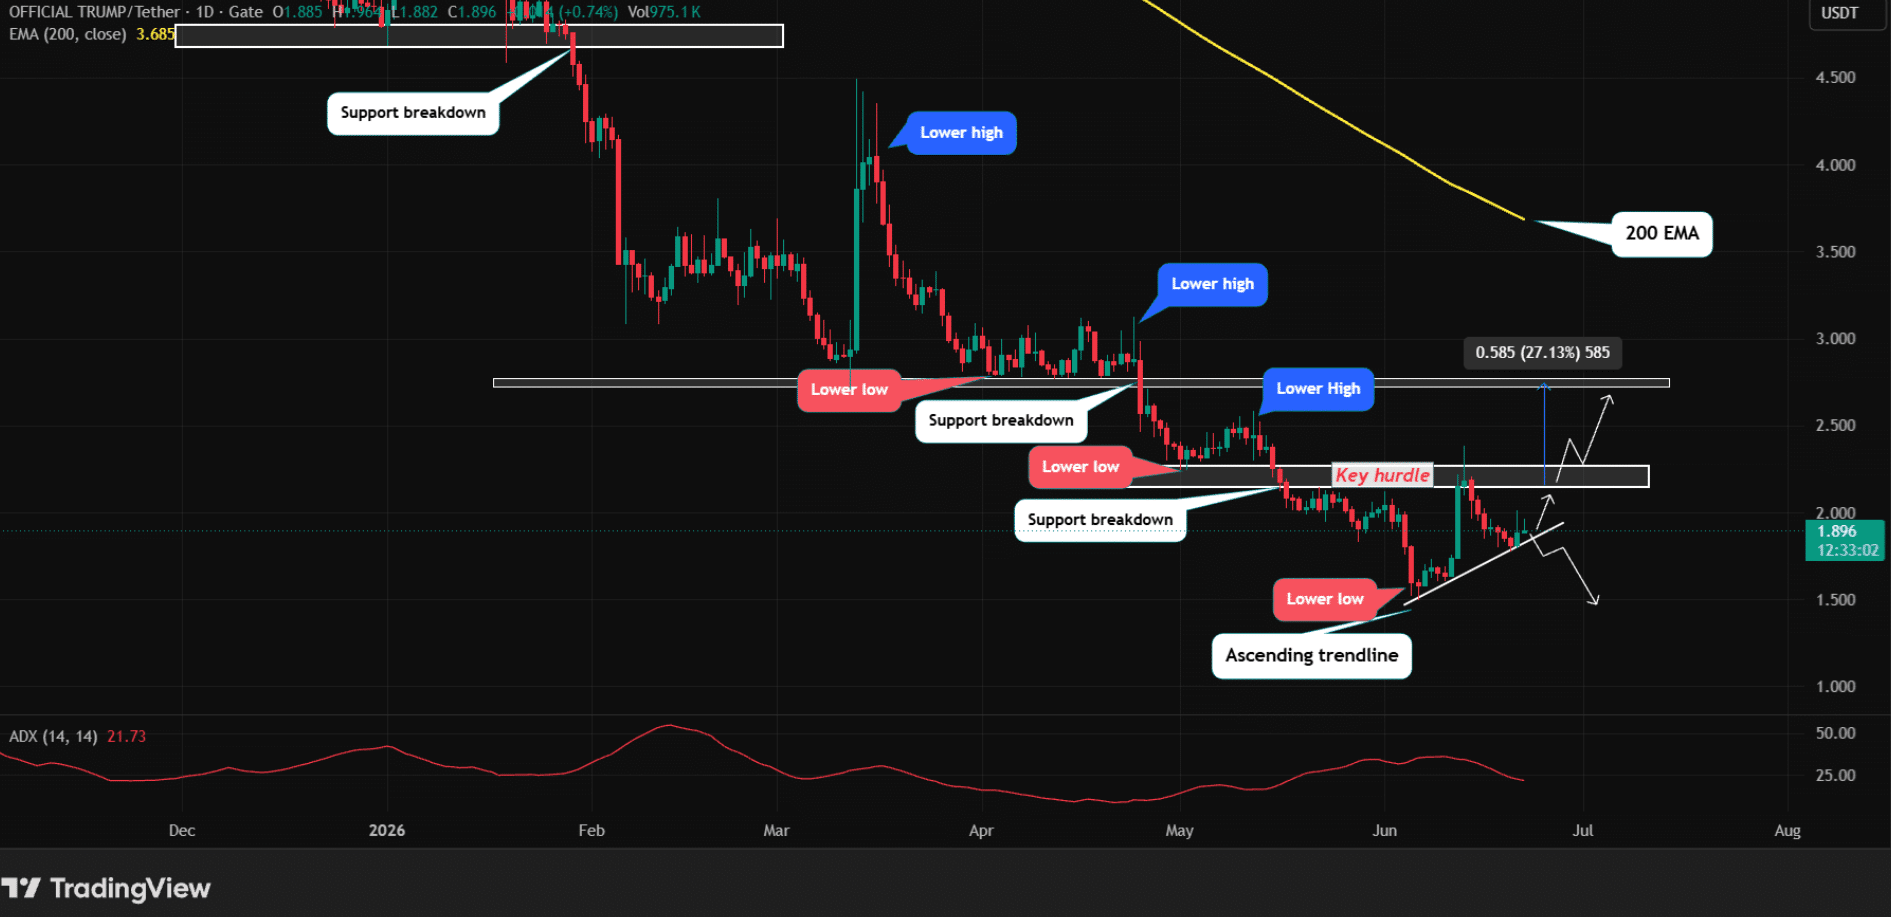
Let’s be honest about where the TRUMP memecoin stands structurally. The broader trend is bearish, and it has been for months. Since launch, the token has carved out a textbook pattern of lower highs and lower lows, meaning every time it rallies, sellers show up and push it back down before it can gain real ground.
Three significant support levels have already given way: $4.67, $2.73, and $2.27, each one breaking down over the past six months. The token is also trading below its 200-day Exponential Moving Average, which is one of the most widely watched indicators in both traditional markets and crypto trading. When an asset sits under that moving average for extended periods, it signals that the dominant pressure is still to the downside.
This is not a minor technical footnote as the 200-day EMA acts as a gravitational ceiling in bearish markets, and reclaiming it would be a meaningful shift in momentum for the TRUMP memecoin.
The Ascending Trendline Giving Bulls a Fighting Chance
Despite the gloomy broader structure, something shifted on June 5, 2026. The TRUMP memecoin found footing on an ascending trendline and has respected it since. This kind of short-term trendline support often attracts speculative buyers who are betting on a near-term bounce, and the rising volume suggests real capital is moving in, not just noise.
If the token holds above this trendline in the coming sessions, upward momentum could build. The next logical target is $2.27, the level that functioned as support throughout much of early 2026 before flipping to resistance after the breakdown. In technical analysis, that kind of level flip is common: support becomes resistance, and breaking back above it sends a strong signal to the market.
A clean close above $2.27 on the daily chart would be the clearest sign yet that the TRUMP memecoin is entering a genuine recovery phase rather than just bouncing within a bearish channel.
What Derivatives Data Reveals About Trader Sentiment
The futures market is painting a surprisingly optimistic picture right now. The Binance Long/Short Ratio for the TRUMP memecoin has reached 2.02, meaning more than twice as many traders are positioned for a price increase as those betting on a decline. That is a meaningful reading by any standard.
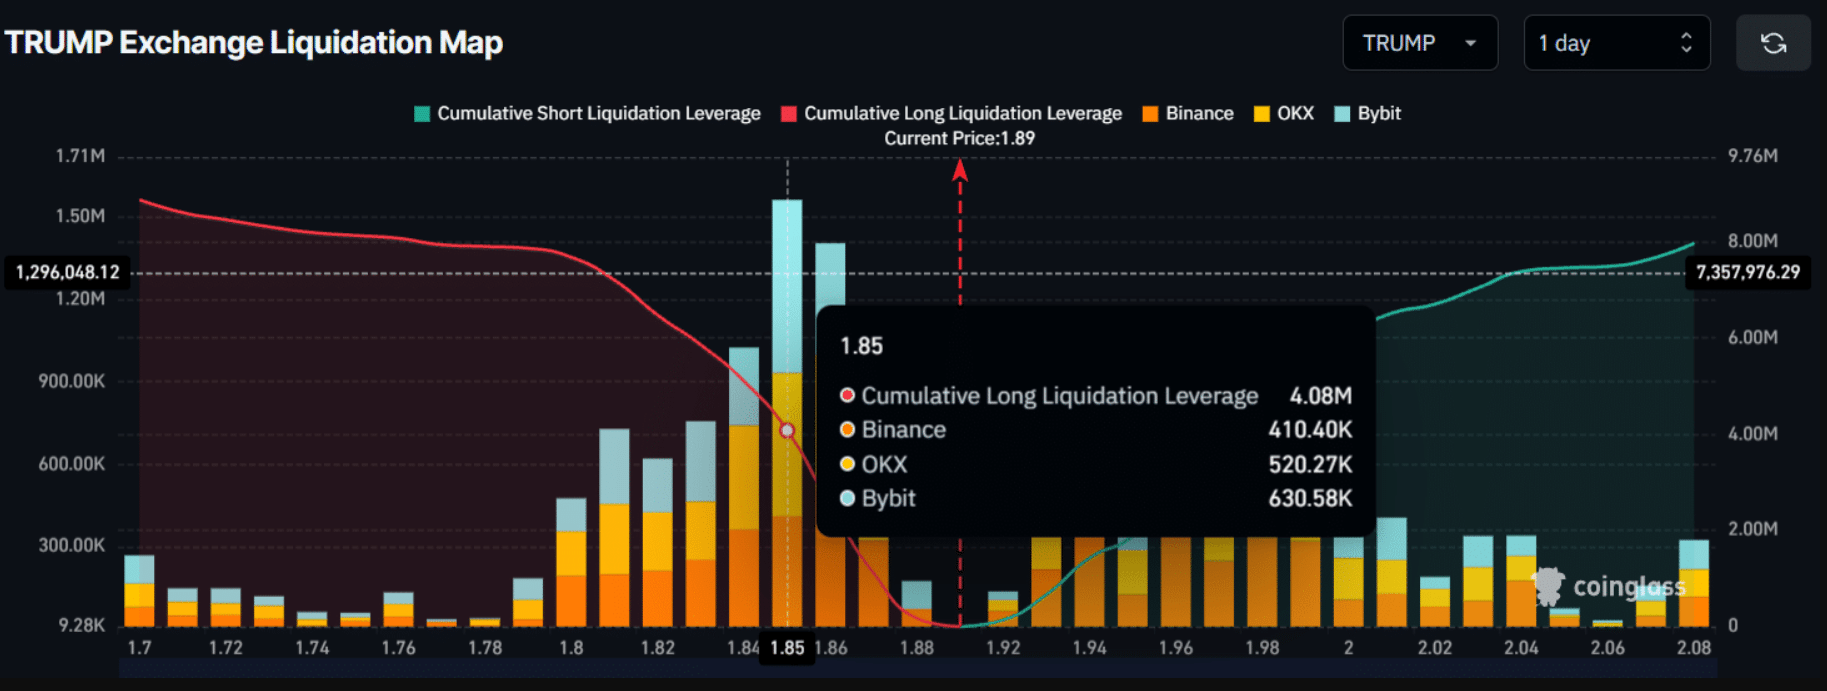
At the $1.96 level, around $4.08 million in long liquidations are clustered, while $2.95 million in short positions sit near the $1.85 mark. These liquidation concentrations work like pressure points. If the price pushes toward $1.96 and triggers those longs, it could accelerate a move upward through a short squeeze effect, similar to what has happened with other memecoins in volatile trading windows.
Spot market data adds another layer to this picture. Roughly $102,990 worth of TRUMP tokens moved off exchanges in the past 24 hours, a behavior that on-chain analysts typically associate with accumulation, meaning holders are moving coins into private wallets rather than preparing to sell.
The ADX Warning Traders Should Not Ignore
Here is where the TRUMP memecoin narrative gets complicated. The Average Directional Index, a tool used to measure trend strength rather than direction, has dropped to 19.13. Any reading below 20 is widely understood in technical trading as a signal of weak or non-existent trend momentum.
This does not mean the price will fall. It means the current upward push lacks conviction and could fizzle before reaching $2.27. Without a meaningful catalyst such as a broader market surge or a significant news event tied to the token, the move may exhaust itself in the short term.
Conclusion
The TRUMP memecoin is at a crossroads that will likely define its near-term trajectory. Sentiment among traders is bullish, accumulation signals are positive, and the ascending trendline has held firm. However, the 200-day EMA, the structural bearish pattern, and a weak ADX reading all serve as reminders that enthusiasm alone does not move markets. The $2.27 level is the line in the sand. Until that resistance breaks convincingly, the bears retain the strategic advantage in this setup.
Frequently Asked Questions
What is the TRUMP memecoin?
The Official Trump (TRUMP) is a memecoin built on the Solana blockchain, associated with branding around Donald Trump and traded primarily on crypto exchanges like Binance.
Why is $2.27 important for the TRUMP memecoin?
It was a key support level that broke down in May 2026 and has since flipped to resistance. Breaking above it would signal a potential trend reversal.
What does the Long/Short Ratio of 2.02 mean?
It means two times more traders are holding long positions than short ones, indicating strong bullish sentiment in the derivatives market.
What is the ADX indicator?
The Average Directional Index measures trend strength on a scale of 0 to 100. A reading below 20 suggests weak trend momentum regardless of direction.
Glossary of Key Terms
Resistance Level: A price point where selling pressure has historically been strong enough to prevent further upward movement.
200-day EMA: The Exponential Moving Average calculated over 200 days, used to identify long-term trend direction.
ADX (Average Directional Index): A technical indicator measuring the strength of a price trend, not its direction.
Long/Short Ratio: A derivatives metric showing the proportion of traders positioned for price increases versus decreases.
Liquidation Level: The price at which leveraged positions are forcibly closed by an exchange due to insufficient margin.
Sources
tradingview
coinglass