Key Highlights Analyst says Bitcoin's MVRV Percentile has dropped to the 5th percentile, a level historically associated with major market bottoms. Structural Market Bands show Bitcoin tradin
Key Highlights
- Analyst says Bitcoin's MVRV Percentile has dropped to the 5th percentile, a level historically associated with major market bottoms.
- Structural Market Bands show Bitcoin trading within a key long-term support zone between $55.9K and $61.4K.
- Both on-chain indicators suggest Bitcoin is in a historically undervalued accumulation zone rather than a prolonged bearish phase.
Bitcoin is currently trading at $65,575.99, with a market capitalization of approximately $1.31 trillion. The asset has shown resilience in recent sessions, posting gains of +2.19% over the last 24 hours, +4.62% over the past 7 days, and +2.05% over the past 30 days.
 Bitcoin (BTC) Price on 21 July 2026/Source: Coinmarketcap
The Macro Backdrop — CPI Relief Continues Supporting Risk Assets
The immediate catalyst for Bitcoin’s recent stability and modest recovery remains the macro environment we have been tracking since the mid-July CPI print. As we covered in our Bitcoin CPI ETF inflows article — headline CPI came in at 3.5% YoY versus 3.8% expected, with Core CPI at 0.0% month-over-month — the most encouraging inflation reading since the pandemic.
The reduced probability of near-term Federal Reserve rate hikes has provided a consistent tailwind for risk assets including Bitcoin — removing one of the most persistent macro headwinds that had been suppressing price action throughout much of 2026. This macro improvement is the backdrop against which today’s on-chain signals are appearing — and that combination of improving macro and deeply undervalued on-chain readings is what gives the current setup more substance than either factor would carry alone.
Signal 1 — MVRV Percentile at the 5th: 95% of Bitcoin’s History Was More Expensive
On-chain analyst @Darkfost_Coc highlighted a metric that provides one of the most historically grounded valuations of Bitcoin’s current price zone: the MVRV Percentile.
What MVRV Percentile measures:
Standard MVRV (Market Value to Realised Value) compares Bitcoin’s current market capitalisation to the aggregate cost basis of all Bitcoin in circulation. The MVRV Percentile goes a step further — it places the current MVRV reading in the context of its full historical distribution, showing what percentage of Bitcoin’s history has seen a higher MVRV than today.
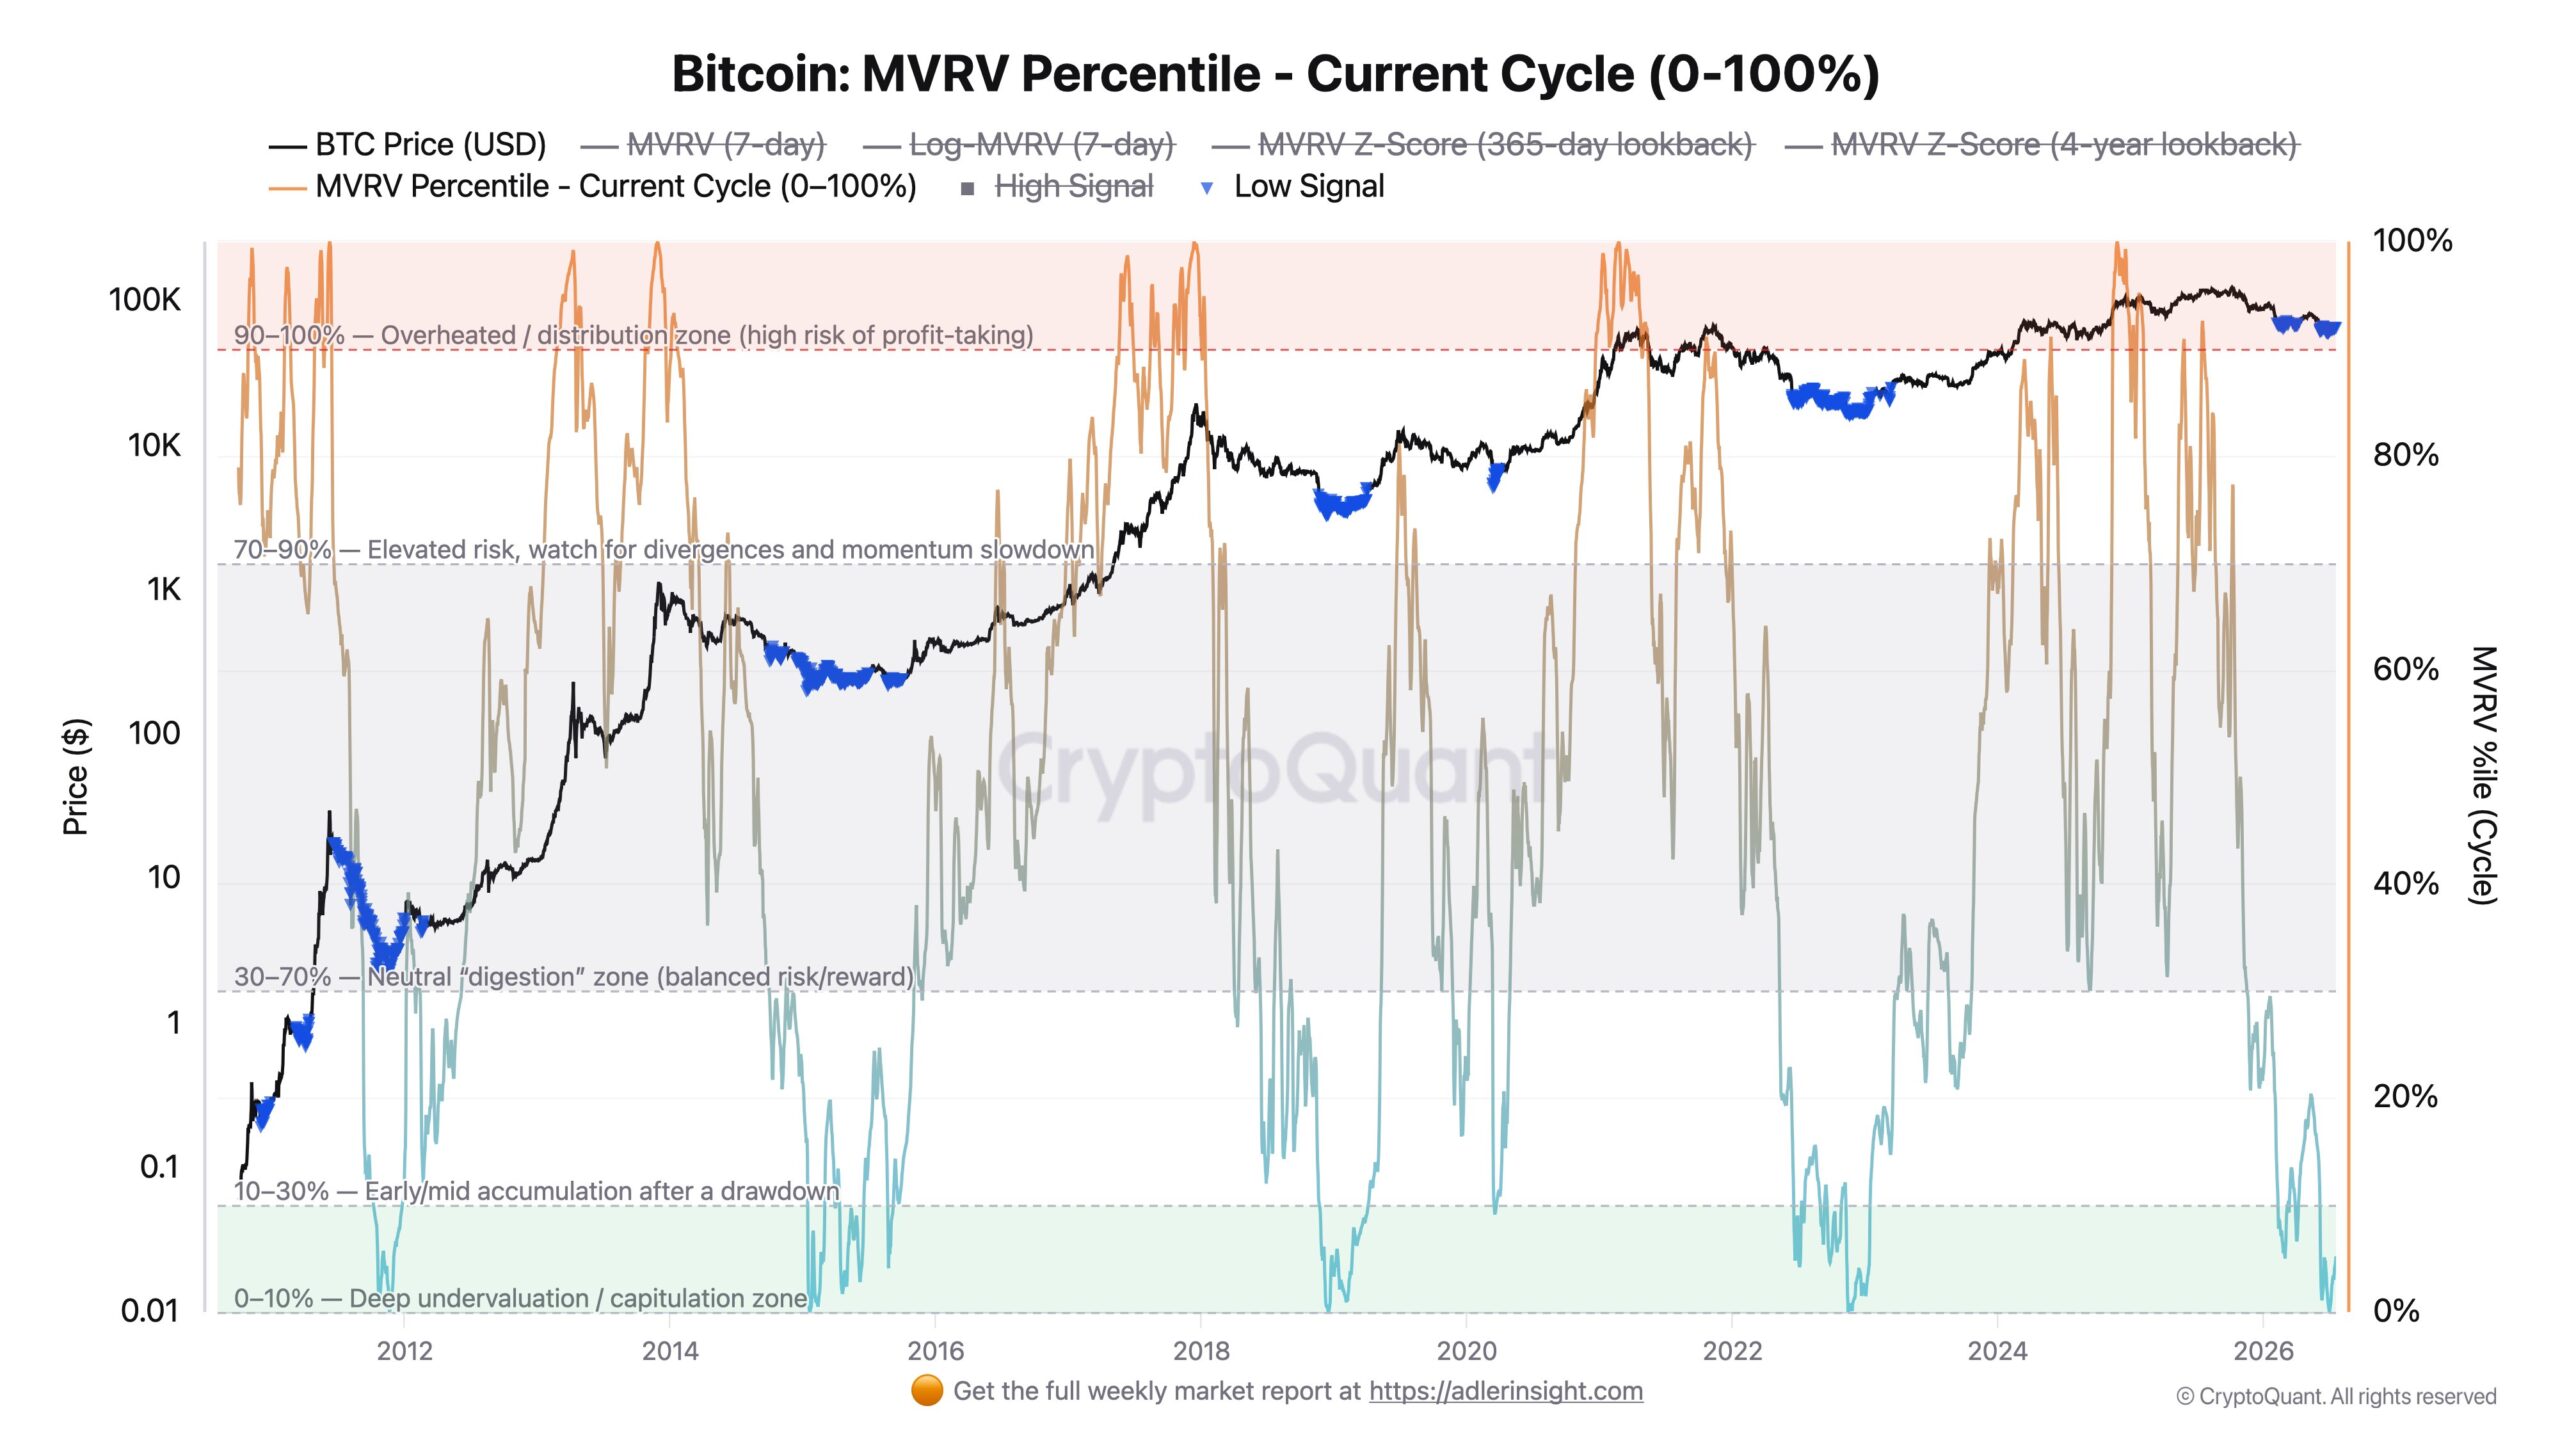 Bitcoin MVRV Percentile Chart/Credits & Source: @Darkfost_Coc
The current reading:
Bitcoin’s MVRV Percentile currently sits at approximately the 5th percentile.
In plain terms: Bitcoin has traded at a higher MVRV valuation for 95% of its entire history. The asset is currently cheaper, relative to the aggregate cost basis of all its holders, than it has been at almost any other point in its existence.
The historical context:
The indicator briefly entered the capitulation zone (below the 10th percentile) in February 2026 when Bitcoin dropped below $60,000 — and has declined again since June to reach the current 5th percentile reading. These low-percentile readings — in the single digits — have historically aligned with major long-term cycle lows in prior Bitcoin cycles, including the 2018–2019 bottom, the 2020 COVID crash, and the 2022 cycle low.
This does not mean the bottom is necessarily today’s specific price. It means that, by this specific metric, the asymmetry strongly favours buyers over sellers at current valuations relative to Bitcoin’s own historical distribution.
Signal 2 — Structural Market Bands: Inside the Support Zone
The second signal comes from @Alphractal’s Structural Market Bands model — developed by a PhD atomic physicist and applying structural physics principles to Bitcoin’s price distribution.
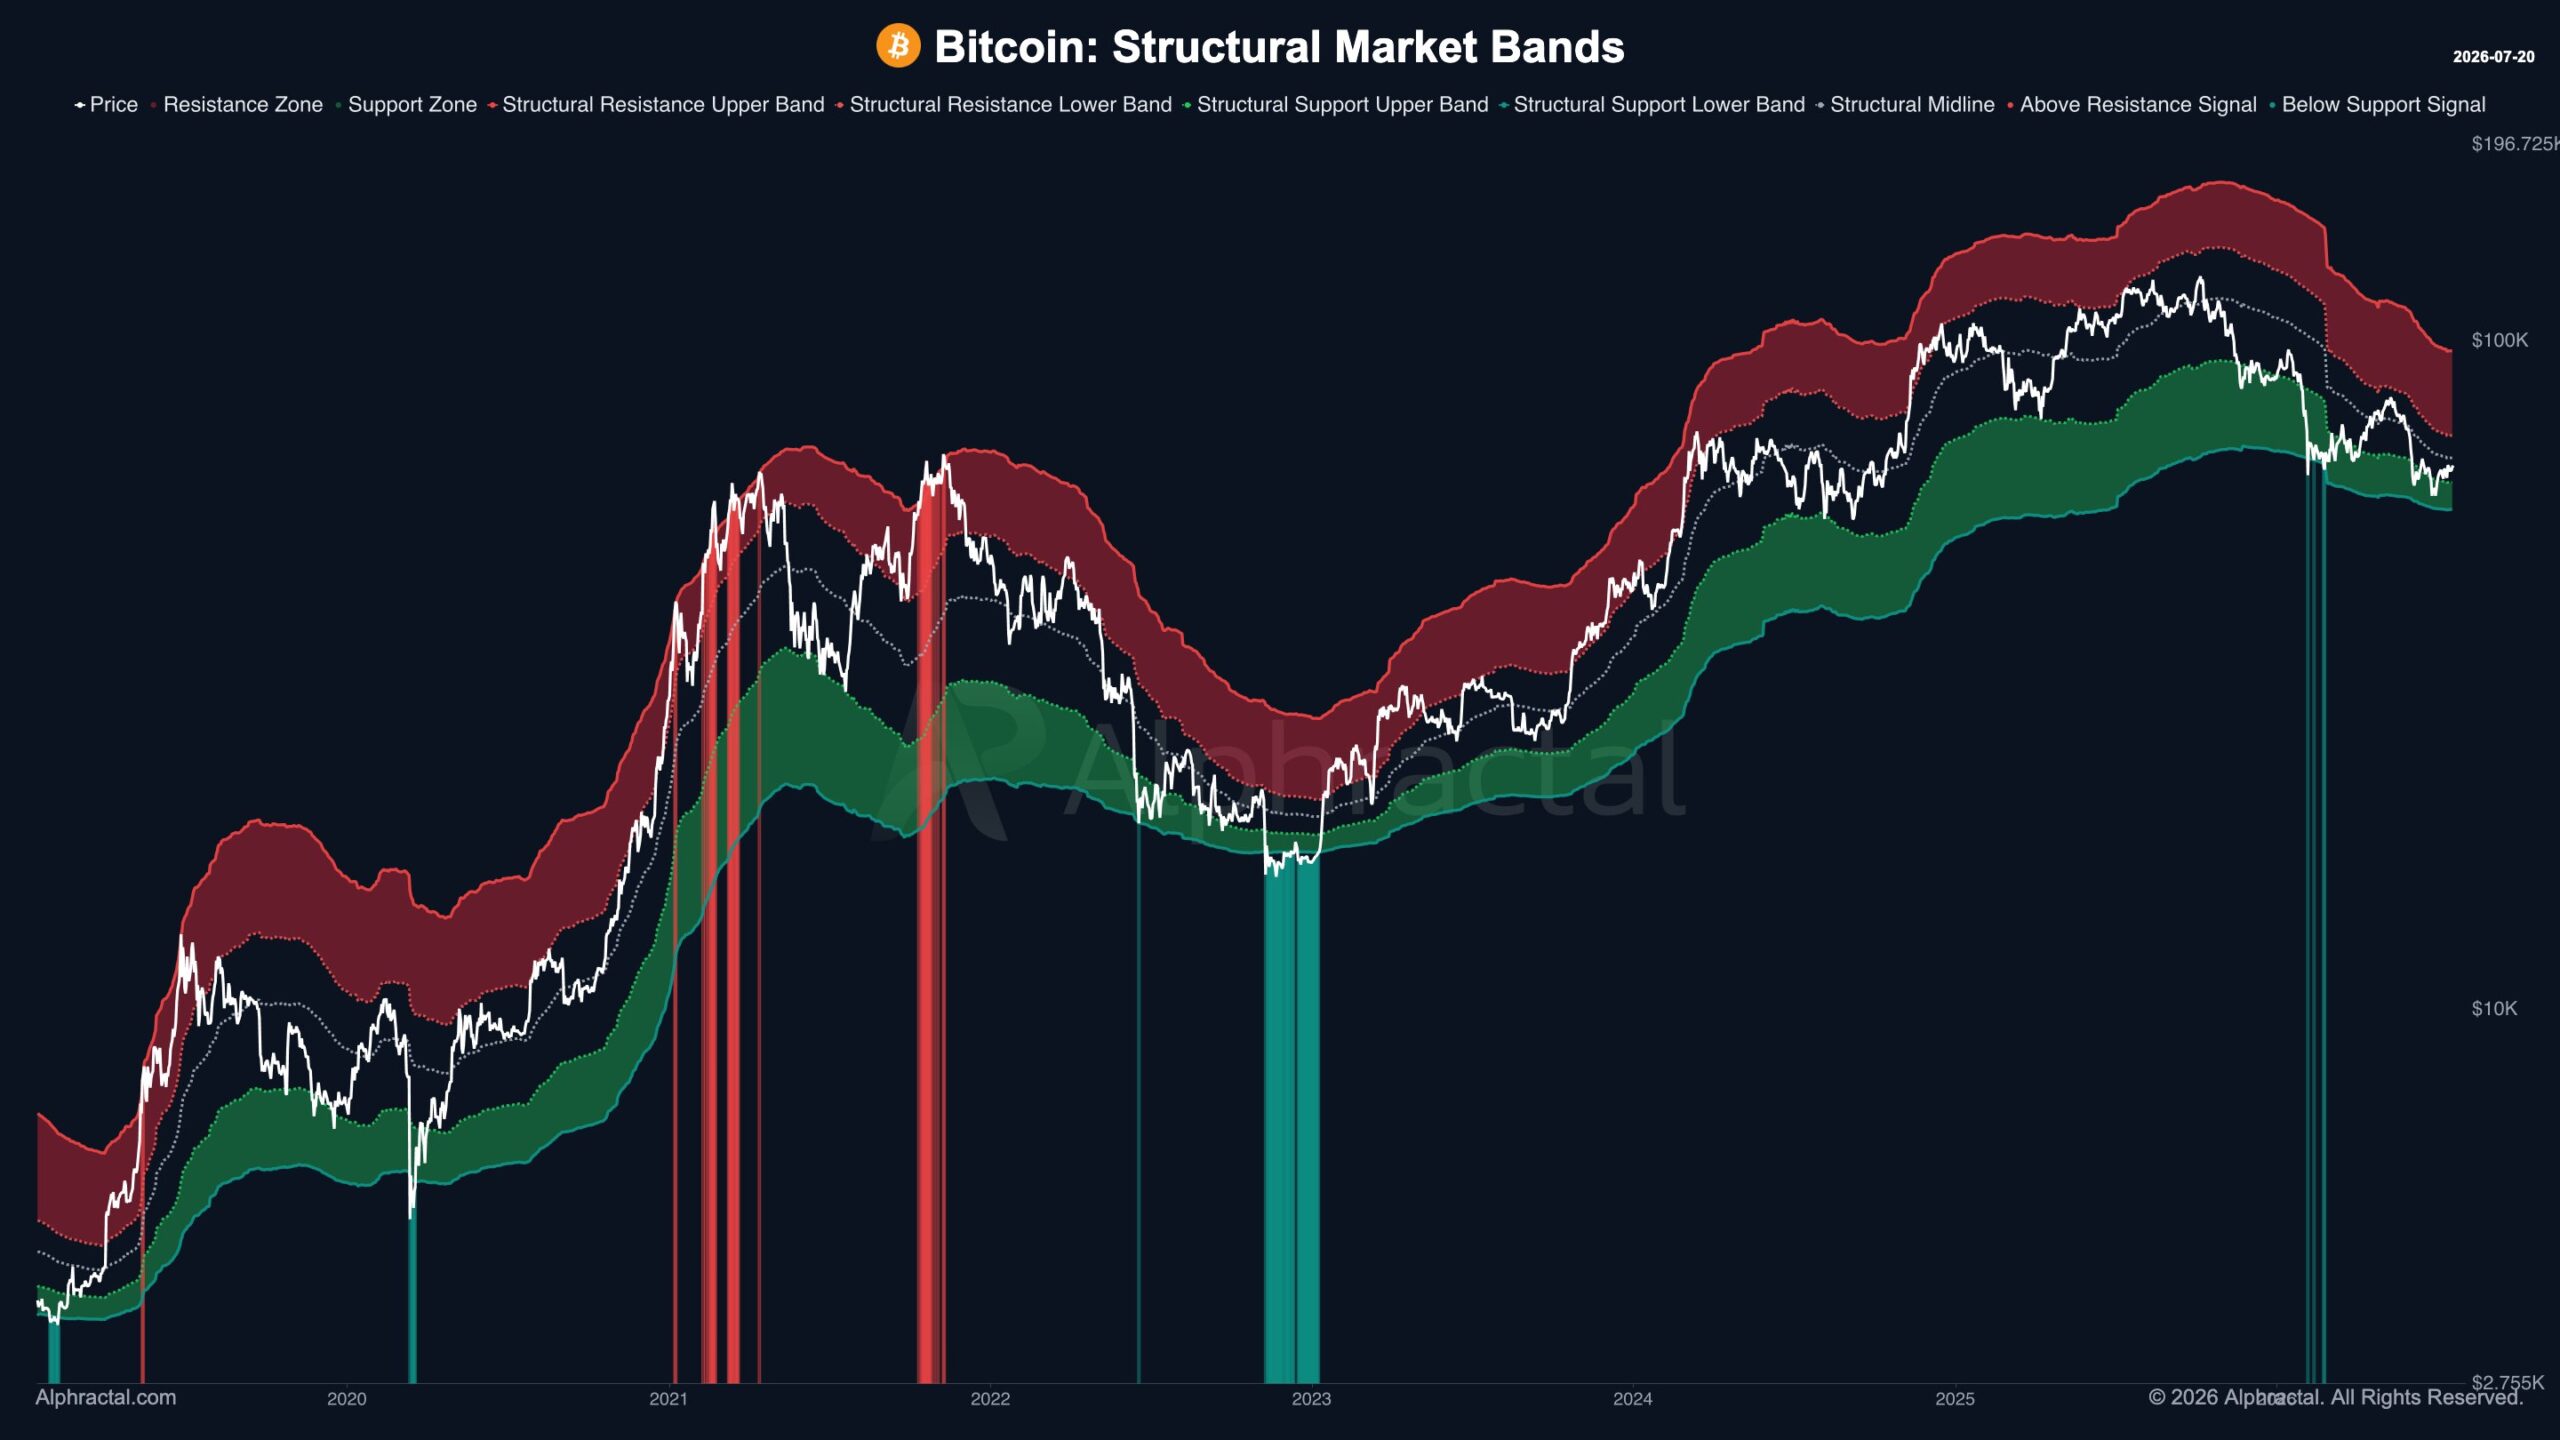 Bitcoin Structural Market Bands (SMB)/Credits & Source: @Alphractal (X)
The current band levels as of July 20, 2026:
Band LevelPriceResistance Upper Band~$96,400Resistance Lower Band~$72,000Structural Midline~$66,700Current Price~$65,575Support Upper Band~$61,400Support Lower Band~$55,900
Where Bitcoin currently sits:
Bitcoin is trading just below the structural midline at $66,700 — inside the upper portion of the support zone, between the structural midline and the support upper band at $61,400.
What this positioning means:
According to the model’s framework — price entering the support zone during a downtrend typically reflects panic or capitulation selling that generates increasing counter-pressure toward mean reversion. The further price pushes into the support zone, the more structural counter-pressure builds against continued downside movement.
The model is careful to note that a touch of the support zone is not a standalone buy signal — it must be read alongside trend context. But it does identify the current price zone as one where the balance of structural pressure is shifting from sellers toward buyers, as the discount from the model’s midline and upper resistance bands becomes increasingly extreme.
The resistance levels provide the recovery roadmap:
A recovery toward the $72,000 resistance lower band — approximately +9.8% from current levels — would be the first signal that the structural counter-pressure is resolving into an actual upward move. A sustained break above $72,000 would open the path toward the $96,400 resistance upper band as the next structural target.
Two Signals, One Picture
What makes today’s analysis particularly compelling is that both signals are arriving from fundamentally different analytical frameworks — yet pointing toward the same conclusion:
The MVRV Percentile is a pure on-chain metric measuring Bitcoin’s current holder profit/loss distribution relative to its entire history. It is agnostic to price patterns and technical structure — it simply measures whether the market is collectively cheap or expensive relative to aggregate cost basis.
The Structural Market Bands model is a physics-based quantitative framework measuring where Bitcoin’s current price sits within structural support and resistance zones derived from its price distribution behaviour. It is agnostic to on-chain data — it measures structural price positioning.
Two completely different methodologies. Both identifying the same zone — the current $61,400–$66,700 range — as a historically significant area of undervaluation and structural support where mean-reversion pressure builds.
This cross-framework confirmation is consistent with the broader body of evidence we have been documenting throughout June and July 2026 — including the 45% of LTH supply in loss with continued accumulation, the Porkopolis Power Law 4.3% quantile generational entry signal, the 147-day bullish weekly divergence cycle comparison, and the Bitcoin falling wedge and TOTAL2 trendline setup — each measuring the same underlying dynamic from a different analytical angle.
What Confirmation Would Look Like
Both models point to the current zone as historically significant support — but both also emphasise that the support zone does not automatically produce a recovery. What would confirm that the structural counter-pressure is translating into genuine upward movement:
First confirmation — Sustained close above the structural midline at $66,700: This would signal that Bitcoin has moved from the lower-pressure support zone back to the equilibrium midline — the first meaningful upward structural shift.
Second confirmation — Break above the $72,000 resistance lower band: This would confirm the recovery is not a brief mean-reversion bounce but a genuine directional move toward the upper structural targets.
Third confirmation — The $96,400 resistance upper band: The full structural recovery target — representing approximately +46.9% upside from the current price — that would signal a return to the upper portion of the structural range.
Bottom Line
Bitcoin at $65,575 is sitting at the intersection of two independently derived signals that both identify the current zone as historically significant. An MVRV Percentile at the 5th — meaning 95% of Bitcoin’s history has been more expensive by this measure — provides on-chain evidence of deep undervaluation. And the Structural Market Bands model places current price in the support zone where counter-pressure toward mean reversion historically builds.
Together, these signals suggest Bitcoin may be forming a base rather than continuing a deeper correction — consistent with every other signal we have documented throughout the current accumulation period. Confirmation requires sustained price action above the $66,700 structural midline first, and then the $72,000 resistance lower band for the more meaningful recovery signal.
Disclaimer: The views and analysis presented in this article are for informational purposes only and reflect the author’s perspective, not financial advice. Technical patterns and indicators discussed are subject to market volatility and may or may not yield the anticipated results. Investors are advised to exercise caution, conduct independent research, and make decisions aligned with their individual risk tolerance.
Read Also: $PUMP Momentum Builds: Ansem Buying + Power of 3 Structure Signals 56% Move Ahead