Unibase is a decentralized data infrastructure protocol focused on verifiable storage and indexing for on-chain and AI-driven applications. UB is the network's native token, used for staking,
Unibase is a decentralized data infrastructure protocol focused on verifiable storage and indexing for on-chain and AI-driven applications.
UB is the network's native token, used for staking, data verification incentives, and network fees.
This Unibase Price Prediction looks at whether UB's sharp pullback is setting up a trap for late sellers or confirming a genuine trend reversal, based on current chart structure, liquidation activity, and exchange volume data.
Here's what the numbers show.
Market data checked on August 5, 2026, at 12:12 IST.
Unibase Price Prediction Today: Market Overview
Metric
Value
Price
$0.11882
24h Change
-40%
Market Cap
$295.99M
Unlocked Mkt Cap
$480.99M
FDV
$1.18B
24h Volume
$67.6M+
Vol/Mkt Cap (24h)
21.58%
Liq/Mkt Cap
1.25%
Total Supply
10B UB
Max Supply
10B $UB
Circulating Supply
2.5B $UB
Holders
68.54K
Source: Data from CoinMarketCap as of August 5, 2026, at 12:12 IST. Figures may vary slightly across other tracking websites.
Unibase Liquidation and Volume Data
Futures liquidation and exchange volume figures below are sourced from Coinglass and are kept separate from the spot volume referenced above.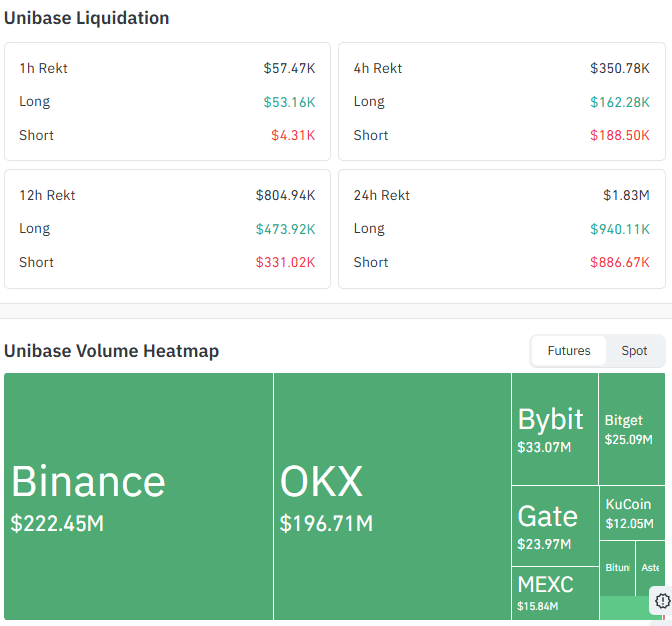
Source: Data From CoinGlass
Window
Total Rekt
Long
Short
1h
$57.47K
$53.16K
$4.31K
4h
$350.78K
$162.28K
$188.50K
12h
$804.94K
$473.92K
$331.02K
24h
$1.83M
$940.11K
$886.67K
Long liquidations dominate the 1h window sharply, showing leveraged longs got caught first as the drop accelerated.
Over the 4h to 24h windows, the split evens out closely between longs and shorts, reflecting the two-sided volatility of a near-40% single-day move rather than a one-sided flush.
Futures Exchange Volume (24h)
Exchange
Volume
Binance
$222.45M
OKX
$196.71M
Bybit
$33.07M
Bitget
$25.09M
Binance and OKX together account for the large majority of futures volume, with both venues far ahead of the rest of the field, pointing to concentrated activity during the sell-off.
UB Price Prediction Chart: Technical Analysis
Pair: UB/USDT · Market: Spot (Crypto) · Timeframe: 4H · Source: TradingView · Timestamp: August 5, 2026, 12:12 UTC+5:30
UB had been climbing steadily along a rising ascending trendline since mid-July, but the price broke below that trendline in 4th August.
What came next was a pullback toward the $0.13990 zone, a classic retest of the broken trendline from underneath, but the level held as resistance rather than flipping to support.
UB failed that pullback and continued falling sharply, dropping from the retest zone down to the current $0.11882, right into a horizontal support and RSI bearish area.
The EMA 20 (Exponential Moving Average, a momentum indicator that weights recent candles more heavily) sits well above at $0.16032, with the EMA 50 close behind at $0.15419, both now far from the current price after the drop.
This failed retest at $0.13990 is the key structural signal here. As long as UB stays below that level, the breakdown remains the dominant trend.
RSI at 35.32 shows the pullback has pushed near to oversold territory, which can precede a bounce, but a bounce alone would not confirm a trend change without reclaiming the broken trendline zone.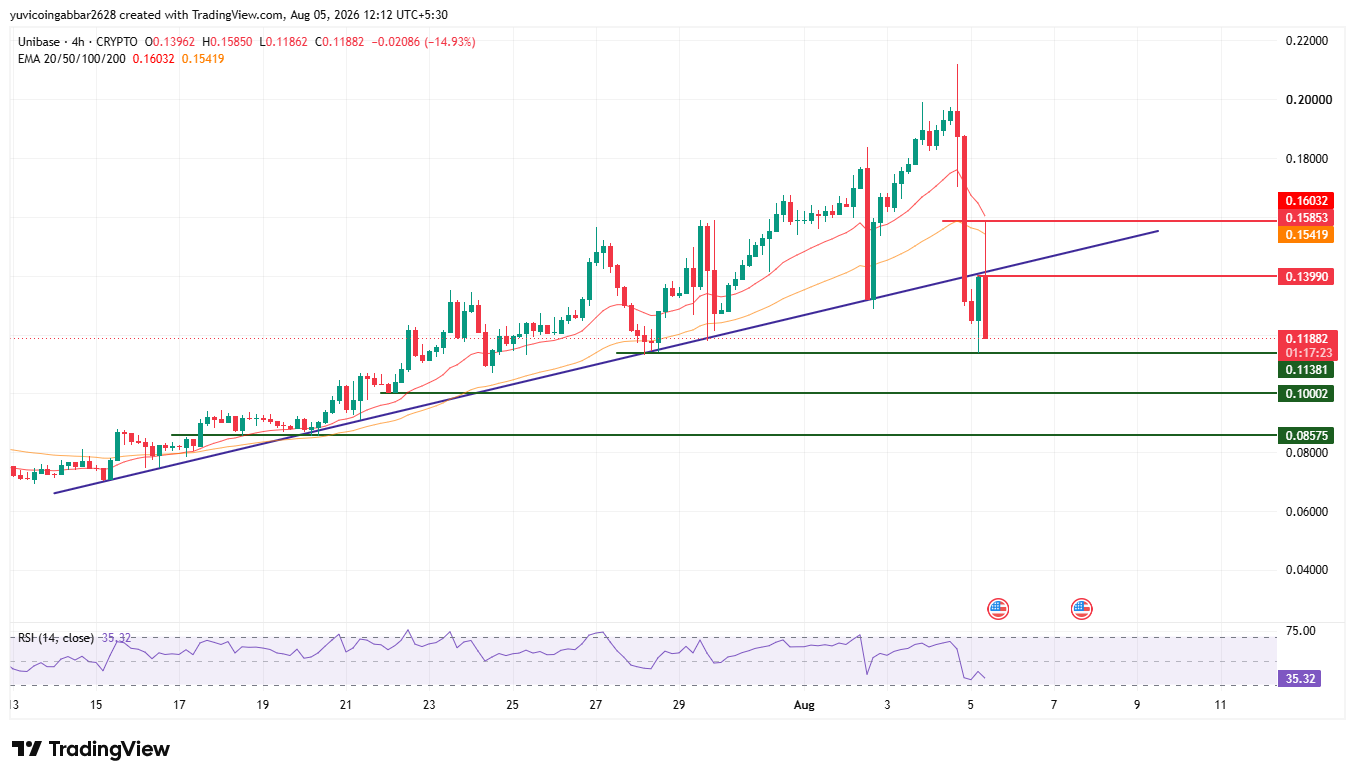
Support and Resistance Levels
Level Type
Price
Resistance 3 (EMA 20 zone)
$0.16032
Resistance 2
$0.15853
Resistance 1 (nearest, failed retest)
$0.13990
Immediate Price Reference
$0.11882
First Support
$0.11381
Deeper Support
$0.10002
Structural Floor
$0.08575
EMA Levels
EMA
Price
EMA 20
$0.16032
EMA 50
$0.15419
UB price target: Unibase Forecast: Bull Case vs. Bear Case
UB price target 2026 Bull case: If UB holds the first confirmed support at $0.11381 and stabilizes, a relief bounce toward the failed retest zone at $0.13990 becomes possible.
A confirmed close back above $0.13990 would be needed to seriously question the breakdown, opening the path toward $0.15853 and the EMA 20 zone near $0.16032 and above.
UB price target 2026 Bear case: As long as UB trades below $0.13990, the trendline breakdown and failed retest remain the dominant structure.
A break below the first confirmed support at $0.11381 would expose $0.10002, and losing that would put the structural floor at $0.08575 in play.
Can UB Reach $0.16032?
$0.16032 is the upper resistance level marked on the chart, sitting at the EMA 20 zone.
Reaching it would require UB to first reclaim the failed retest level at $0.13990, a level that has already rejected price once, and then clear $0.15853, a multi-stage recovery that would need to fully invalidate the current breakdown structure.
What Could Invalidate the Bullish Setup?
A break below the first confirmed support at $0.11381 would suggest the pullback toward current levels is a temporary pause rather than a base.
A deeper break below $0.10002 and the structural floor at $0.08575 would confirm the trendline breakdown is continuing rather than reversing.
Unibase Price Prediction 2026: Expert View
According to CoinGabbar analysts, the liquidation data shows longs got hit first and hardest in the 1h window as the drop accelerated, but the 24h picture evens out between longs and shorts, suggesting the move drew in leveraged positioning on both sides rather than triggering a single cascading squeeze.
Futures volume concentrated heavily on Binance and OKX, which together handle the bulk of activity, indicating the sell-off played out across major venues rather than being driven by thin liquidity on smaller exchanges.
The $0.11381 to $0.13990 range is the zone to watch most closely: holding the lower end keeps a relief bounce possible, while a reclaim of the upper end would be needed to seriously challenge the breakdown. Until then, the failed retest keeps the structure bearish.
Unibase Price Prediction: Data Sources
Price and EMA data referenced from a 4H UB/USDT chart via TradingView, timestamped August 5, 2026, 12:12 UTC+5:30.
Market cap, FDV, volume, and supply data referenced from CoinMarketCap. Liquidation and exchange volume data referenced from Coinglass.
Disclaimer: This piece is for informational purposes only and isn't financial advice. The levels and scenarios above are based on technical chart analysis and publicly available data at the time of writing, and crypto markets can move sharply within hours, so past patterns don't guarantee future outcomes. It's worth doing independent research and considering your own risk tolerance before acting on any of the levels discussed here.