Uniswap just pushed through a resistance zone that had capped prices for months, and the move is backed by a real jump in volume. $Uniswap is a decentralized exchange protocol that lets users
Uniswap just pushed through a resistance zone that had capped prices for months, and the move is backed by a real jump in volume.
$Uniswap is a decentralized exchange protocol that lets users trade tokens directly from their wallets without a centralized order book, according to its own project materials.
This Uniswap Price Prediction August 2026 looks at whether $UNI can hold above its newly broken resistance and push toward it. Here's the full breakdown.
Uniswap Price Prediction Today: Market Overview
Metric
Value
Price
$4.0504
24h Change
+5.19%
Market Cap
$2.53B (+5.19%)
24h Volume
$311.48M (+19.98%)
Vol/Mkt Cap (24h)
12.39%
FDV
$3.61B
TVL
$3.05B
Market Cap/TVL
0.815
Total Supply
892.17M UNI
Max Supply
1,000,000,000 $UNI
Circulating Supply
625.03M $UNI
Profile Score
65%
Source: Data from CoinMarketCap as of 30/07/2026. Figures may vary slightly across other tracking websites.
UNI forecast August 2026: UNI On-Chain Data and Whale Concentration
On-chain data shows 386,945 holders, up slightly over the past period, with on-chain market cap at $4.04B against a circulating-supply market cap of $2.53B.
A gap that reflects UNI's max total supply of 1 billion tokens against the smaller circulating figure.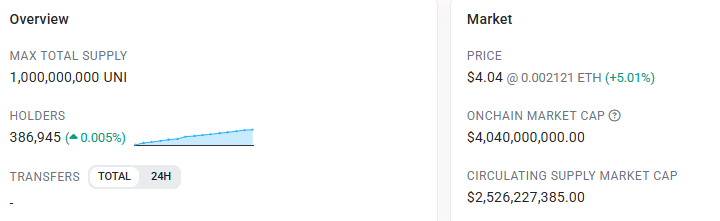
Whale concentration is notably high: whales make up just 0.23% of holders (886 wallets) but control 96.40% of market cap, and the top 100 holders alone account for 82.14% of supply, with the top 10 holders holding 51.74%.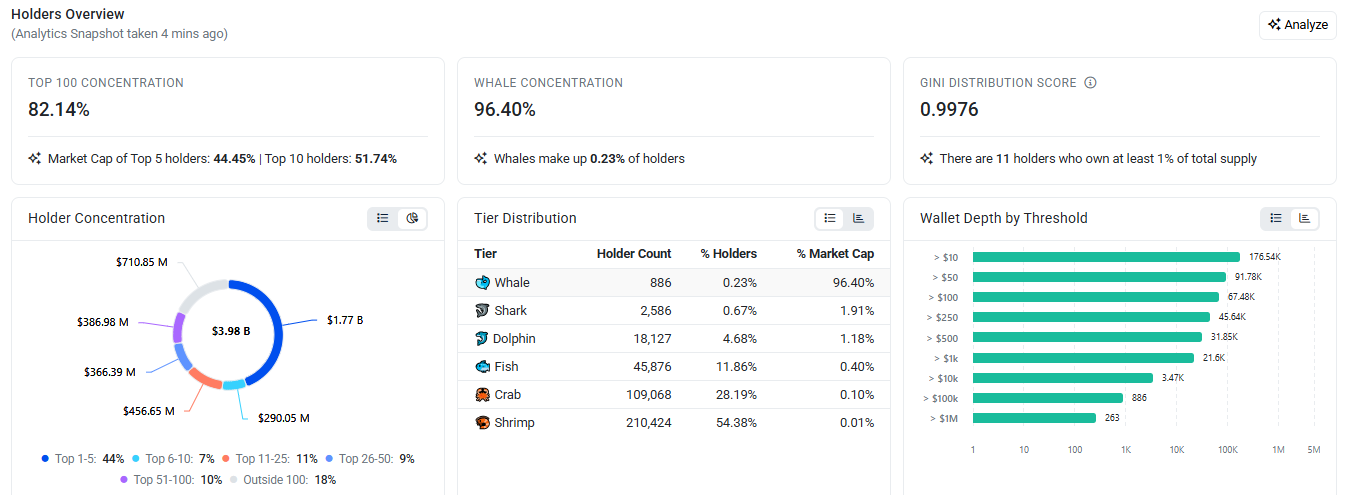
The Gini Distribution Score sits at 0.9976, reflecting extreme concentration, and 11 holders individually own at least 1% of the total supply.
On the other end, Shrimp-tier wallets (holding smaller amounts) make up 54.38% of all holders but only 0.01% of market cap, a reminder that UNI's price action is likely driven more by large-wallet activity than broad retail flow.
Uniswap Technical Analysis: UNI Support and Resistance Levels
Pair: $UNI/USD · Market: Spot (FOREX.com) · Timeframe: 1D · Source: TradingView · Timestamp: July 30, 2026, 13:55 UTC+5:30
$UNI trading at the level of $4.0504, after breaking above a descending trendline that had bound up the price since February.
That breakout also took UNI above its EMA 20 ($3.6935) and EMA 50 ($3.4439), both of which now sit below price as support rather than resistance.
RSI (14) at 67.18 is running hot, approaching overbought territory, which reflects the strength of the current move but also raises the chance of a near-term cooldown.
The next resistance zone above sits at $4.1770, a level UNI is currently testing directly, with the next major zone well above at $4.8032, and a stretch resistance far higher at $5.7237 from the late-2025 range.
But if the price broke the near support of $3.6639, then it can go to the next lower levels.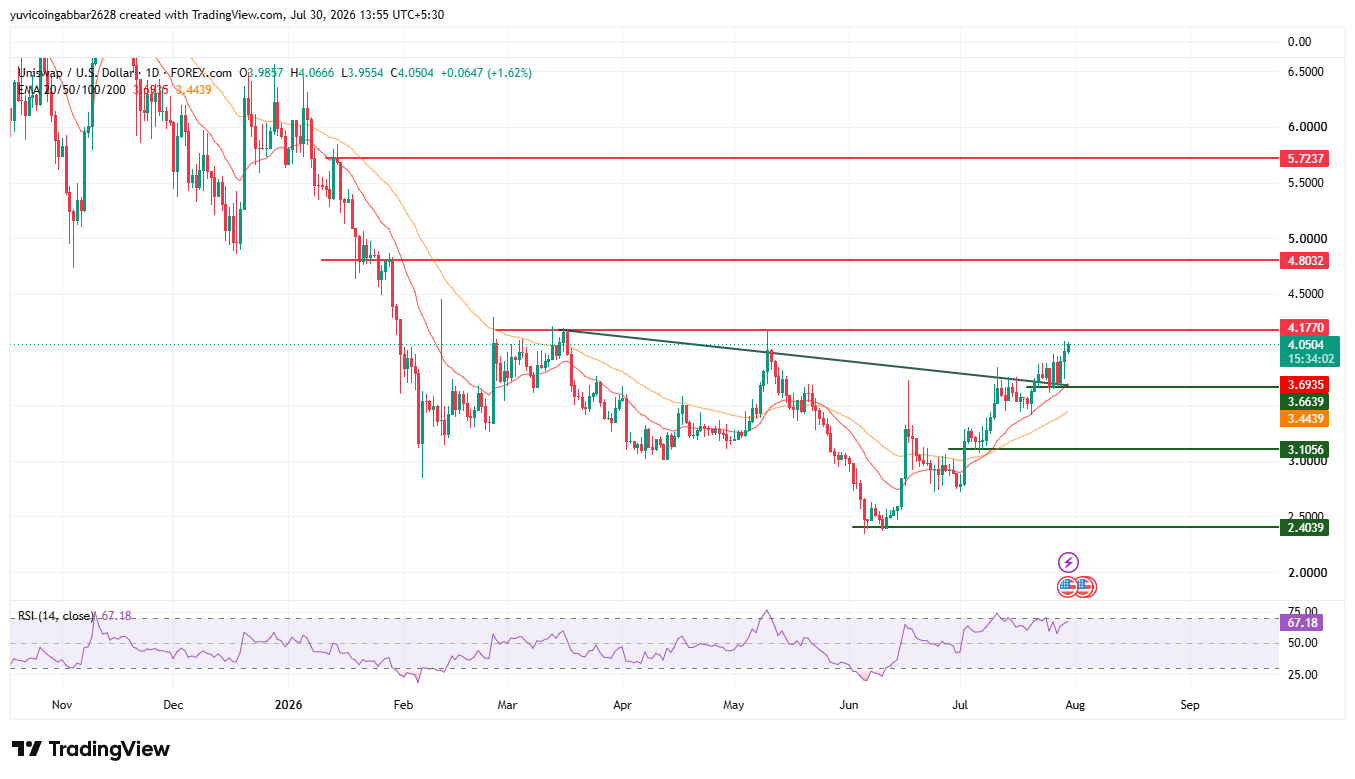
Level Type
Price
Resistance 3
$5.7237
Resistance 2
$4.8032
Resistance 1
$4.1770
Immediate Price Reference
$4.0504
Initial Recovery Level (EMA 20)
$3.6935
First Confirmed Support
$3.6639
EMA 50
$3.4439
Support
$3.1056
Deeper Support
$2.4039
Uniswap Price Prediction August 2026: Bull Case vs. Bear Case
Bull case: If UNI holds above $3.6935 and clears $4.1770, the next level is $4.8032, with a stretch move toward $5.7237 if volume stays elevated.
Bear case: A rejection at $4.1770 followed by a close back below $3.6935 would put the breakout in question, opening a retest of $3.6639 and, if that fails, the EMA 50 near $3.4439 and then next support 3.1036 - 2.4039
Can UNI Reach $4.80?
It's possible with the current momentum, but UNI needs to clear $4.1770 first, a level it's testing right now, before the $4.8032 zone comes into play.
RSI already near overbought suggests the move may need to pause or consolidate before making a fresh push higher, rather than continuing in a straight line.
What Happens If UNI's Breakout Fails?
A close back below $3.6935, which is both the EMA 20 and the broken trendline zone, would be the clearest signal the breakout has failed, shifting focus to $3.6639 as the next support and then the EMA 50 near $3.4439 below that and next more .
Uniswap Price Prediction August 2026: Expert View
According to CoinGabbar analysts, UNI's breakout is backed by real volume up nearly 20% in 24 hours rather than a thin, low-liquidity move, which adds some credibility to the trendline break.
The on-chain picture shows extreme whale concentration, with under a quarter of a percent of holders controlling over 96% of market cap, meaning large-wallet decisions likely matter more here than broad retail sentiment.
With RSI at 67.18, the setup favors a continuation attempt toward $4.1770–$4.8032, but a short-term pullback or consolidation wouldn't be unusual after this size of a move.
UNI price outlook: Data Sources
Price, market cap, TVL, and supply data referenced from a CoinGecko-style tracker as of July 30, 2026, 13:55 IST. Holder and whale concentration data sourced from an on-chain analytics snapshot taken shortly before publication. Chart analysis (EMA, RSI, support/resistance) sourced from a 1D UNI/USD chart on FOREX.com via TradingView, timestamped July 30, 2026, 13:55 IST.
Disclaimer: This article is for informational purposes only and should not be treated as investment advice. Cryptocurrency markets are highly volatile, and readers should conduct their own research before making any financial decisions. CoinGabbar does not guarantee the accuracy of self-reported project figures cited above.