The news comes alongside reports that Uniswap has launched Pools.trade on Robinhood Chain, enabling permissionless token creation. This Uniswap Price Prediction looks at whether the reclaim c
The news comes alongside reports that Uniswap has launched Pools.trade on Robinhood Chain, enabling permissionless token creation.
This Uniswap Price Prediction looks at whether the reclaim can hold over the next few days, with the bullish case staying intact above $3.9238, while a close back below that level would put the move back in question.
Here is what the chart, the news, and the liquidation data show.
Market data checked on August 6, 2026, at 1:03 IST.
Uniswap Price Prediction Today: Market Overview
Metric
Value
Price
$4.0576
24h Change
+3%
Market Cap
$2.53B
FDV
$3.62B
TVL
$3.01B
Market Cap/TVL
0.847
24h Volume
$277.5M+
Vol/Mkt Cap (24h)
10.87%
Total Supply
891.98M UNI
Max Supply
Uncapped
Circulating Supply
624.73M $UNI
Source: Data from CoinMarketCap as of August 6, 2026, at 1:03 IST.
Figures may vary slightly across other tracking websites.
Uniswap Launches Pools.trade on Robinhood Chain: What the News Adds
A post from the account MSB Intel states that Uniswap has launched pools.trade on Robinhood Chain, a move described as enabling permissionless token creation on that network. 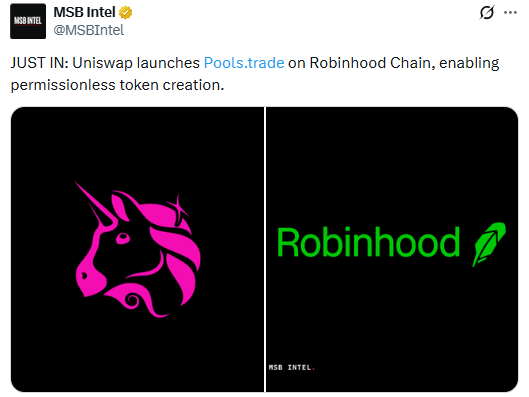
Source: Data From MSB Intel
NOTE: CoinGabbar could not independently verify the specifics of this launch, including trading volume, adoption figures, or the technical details of how Pools.trade integrates with Robinhood Chain, since the source here is a social media post rather than an official Uniswap or Robinhood announcement.
If confirmed and adopted, expanding UNI's ecosystem onto a new chain could support the broader bullish narrative, though the near-term price impact so far appears modest against the backdrop of the trendline reclaim already underway.
Uniswap Liquidation and Volume Data
UNI token forecast & Liquidations (Futures, Coinglass)
Timeframe
Long
Short
Total
1h
$9.94K
$605.98
$10.55K
4h
$19.30K
$5.91K
$25.20K
12h
$50.36K
$20.02K
$70.37K
24h
$111.67K
$288.29K
$399.96K
Liquidations are split across timeframes, with longs taking the larger share in the shorter windows while shorts account for the bulk of the 24h total at $288.29K against $111.67K on the long side.
That mix points to a choppy stretch with positioning getting caught on both sides rather than a single clean squeeze.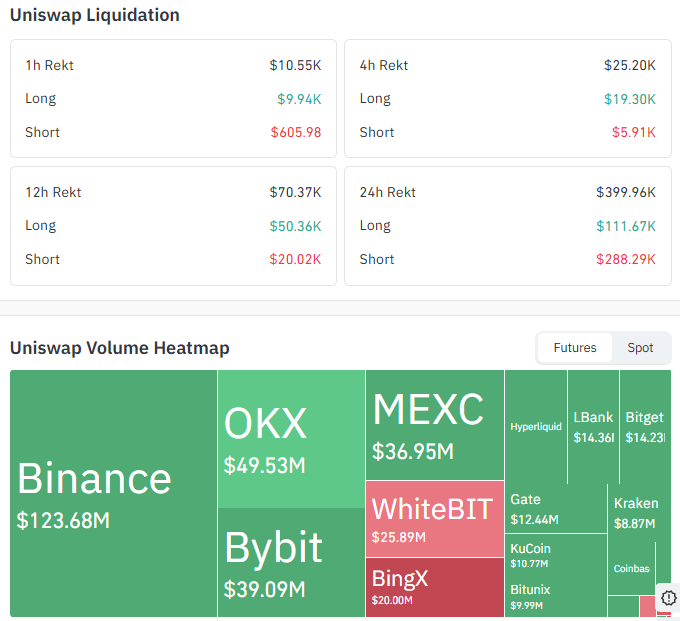
Source: Data From CoinGlass
UNI token forecast: Exchange Volume Breakdown (Futures, Coinglass)
Binance leads futures volume at $123.68M, followed by OKX at $49.53M and MEXC at $36.95M. Bybit adds $39.09M, with WhiteBIT ($25.89M), BingX ($20.00M), LBank ($14.36M), Bitget ($14.23M), Gate ($12.44M), KuCoin ($10.77M), Kraken ($8.87M), Hyperliquid, and Bitunix ($9.99M) rounding out the rest of the tracked exchanges.
This futures data is kept separate from the spot volume figure reported in the market overview table above.
UNI Price Prediction Chart: Technical Analysis
Pair: UNI/USD · Market: Spot (Forex.com feed on TradingView) · Timeframe: 1H · Source: TradingView · Timestamp: August 6, 2026, 11:03 UTC+5:30
UNI is trading at $4.0576 after reclaiming the descending trendline that had capped the price since the July 31 highs near $4.55.
The price bottomed near $3.82 on August 5 before rallying back through the trendline, and the chart marks a clear bullish EMA crossover during that move, where the 50 EMA crossed above the 20 EMA.
RSI (Relative Strength Index, a momentum gauge on a 0 to 100 scale) sits at 52.71, close to neutral, which leaves room in either direction from here.
The EMA 20 and EMA 50 are now sitting just below the current price after that bullish crossover, which is the sign of bullish continuation, with the EMA 20 at $4.0520 and the EMA 50 at $4.0104, both acting as a near-term support cushion rather than resistance following the reclaim.
If UNI sustains at the current level and breaks above the $4.1407 resistance, the upper levels to watch are $4.2880 and $4.4062.
If it breaks below the $3.9238 support instead, the price can move toward the lower levels at $3.8218 and $3.6858.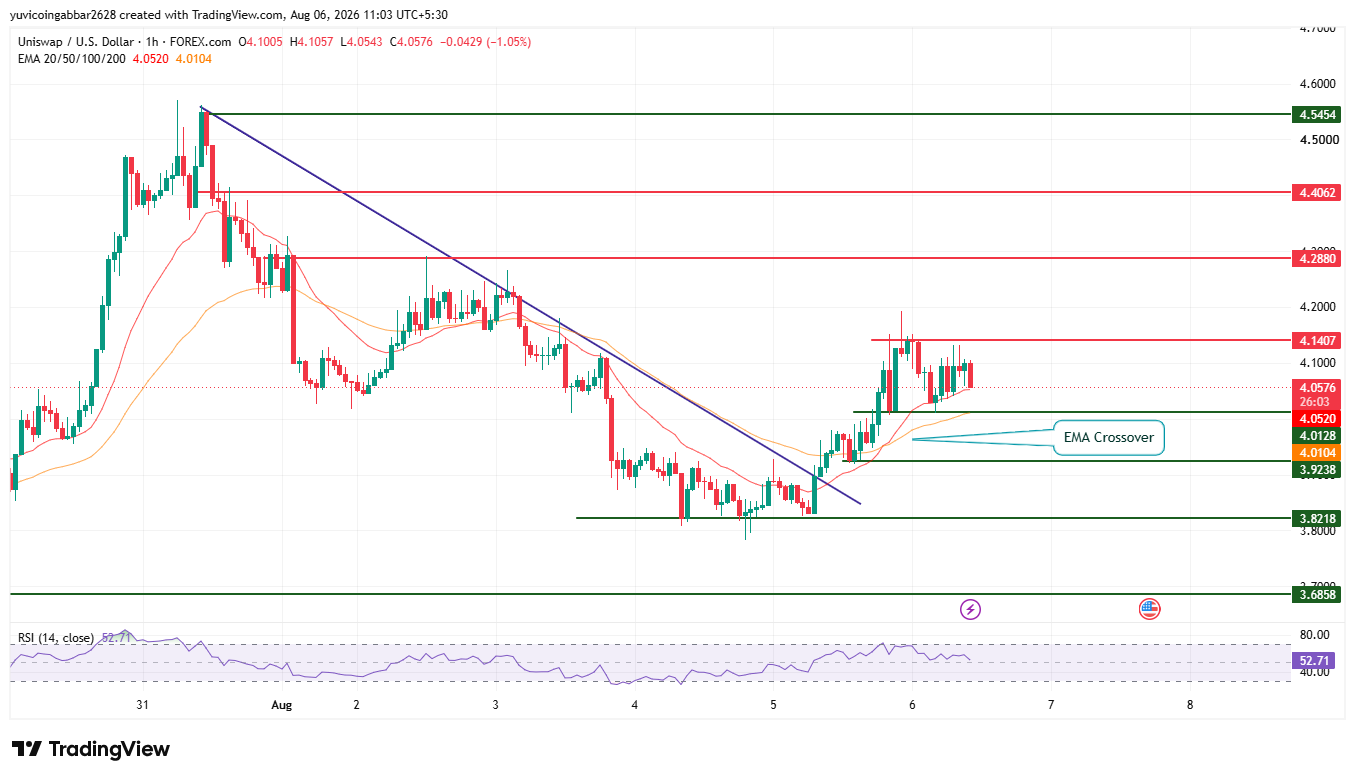
Support and Resistance Levels
Level Type
Price
Resistance 3
$4.5454
Resistance 2
$4.4062
Resistance 1 (nearest)
$4.1407
Immediate Price Reference
$4.0576
First Support (trendline reclaim zone)
$3.9238
Deeper Support
$3.8218
Structural Floor
$3.6858
EMA Levels
EMA
Price
EMA 20
$4.0520
EMA 50
$4.0104
UNI Forecast: Bull Case vs Bear Case
UNI price target 2026 Bull case: Holding above the trendline reclaim zone at $3.9238 and staying above the EMA 20 and EMA 50 near $4.0104 to $4.0520 would suggest the recent bounce is stabilizing into a genuine reversal rather than a bullish bounce.
A confirmed close above the nearest resistance at $4.1407 would open the path toward $4.2880 and eventually $4.4062.
UNI price target 2026 Bear case: A close back below $3.9238 would put the trendline reclaim in doubt and suggest the bounce off the $3.82 low was a temporary relief move within a larger downtrend.
Losing $3.8218 would expose $3.6858 as the next downside level.
Can UNI Reach $4.5454?
$4.5454 is the highest resistance level marked on the chart. Reaching it would require UNI to first clear the nearest resistance at $4.1407, then break and hold above $4.2880 and $4.4062, a multi-stage move that would likely need sustained follow-through from both the EMA crossover setup and continued news flow around the Robinhood Chain integration.
What Could Invalidate the UNI Bullish Setup?
A rejection at the nearest resistance near $4.1407 followed by a close back below the EMA 20 and EMA 50 and the trendline reclaim zone at $3.9238 would put the recovery in question.
A deeper break below $3.8218 and the structural floor at $3.6858 would undermine the bounce entirely and point back toward retesting the recent lows.
Uniswap Price Prediction 2026: Expert View
According to CoinGabbar analysts, The trendline reclaim and EMA crossover together paint a short-term picture of buyers stepping back in after the August 5 low near $3.82, though RSI sitting close to neutral at 52.71 suggests this is still an early-stage move rather than a confirmed trend change.
The liquidation data shows both longs and shorts getting cleared out over the past 24 hours, which is typical of a volatile reversal attempt rather than a one-sided squeeze.
The reported Pools.trade launch on Robinhood Chain adds a longer-term narrative around UNI's ecosystem expansion, though its near-term trading impact remains unverified.
The $3.9238 to $4.1407 zone is the key battleground: holding above it keeps the reclaim thesis intact, while slipping back under $3.9238 would suggest the bounce has run out of steam.
Uniswap Price Prediction: Data Sources
Price, EMA, and RSI data referenced from a 1H UNI/USD chart via TradingView (Forex.com feed), timestamped August 6, 2026, 11:03 UTC+5:30.
Market cap, FDV, TVL, volume, and supply data referenced from CoinMarketCap. Liquidation and futures volume data referenced from Coinglass. Robinhood Chain launch news referenced from a public post on X, unverified beyond that source.
Disclaimer: This piece is for informational purposes only and is not financial advice. The levels and scenarios above are based on technical chart analysis and publicly available data at the time of writing, and crypto markets can move sharply within hours, so past patterns do not guarantee future outcomes. It is worth doing independent research and considering your own risk tolerance before acting on any of the levels discussed here.