$UNI just broke out of a long-term descending trendline, and traders are already pulling it off exchanges, a move often read as bullish. One setup floating around targets as high as $15.70 if
$UNI just broke out of a long-term descending trendline, and traders are already pulling it off exchanges, a move often read as bullish.
One setup floating around targets as high as $15.70 if the current structure holds. UNI is up over 3% today, trading near $6.32.
This Uniswap price prediction checks that bullish setup, the exchange outflow data, and the liquidation picture against what the chart is actually showing right now.
Market data was checked on September 14, 2026, based on the chart timestamped 04:07 (UTC-3).
Uniswap Price Prediction Today: Market Overview
Metric
Value
Price
$6.3208
Market Cap
$3.92B (+1.89%)
24h Volume
$358.72M (+9.35%)
Vol/Mkt Cap (24h)
9.1%
FDV
$5.63B
Total Value Locked (TVL)
$3.87B
Market Cap/TVL
1.01
Total Supply
888.66M UNI
Max Supply
Uncapped
Circulating Supply
621.41M UNI
Source: Data from CoinMarketCap as of September 14, 2026, at 16:21 IST. Figures may vary slightly across other tracking websites.
$UNI Liquidation Data and Volume Heatmap
Window
Total Liquidated
Longs
Shorts
1h
$13.76K
$6.28K
$7.48K
4h
$48.96K
$28.49K
$20.47K
12h
$348.68K
$261.86K
$86.81K
24h
$582.43K
$426.54K
$155.89K
Longs have taken the larger share of liquidations across every window, picking up as the trendline breakout has extended. 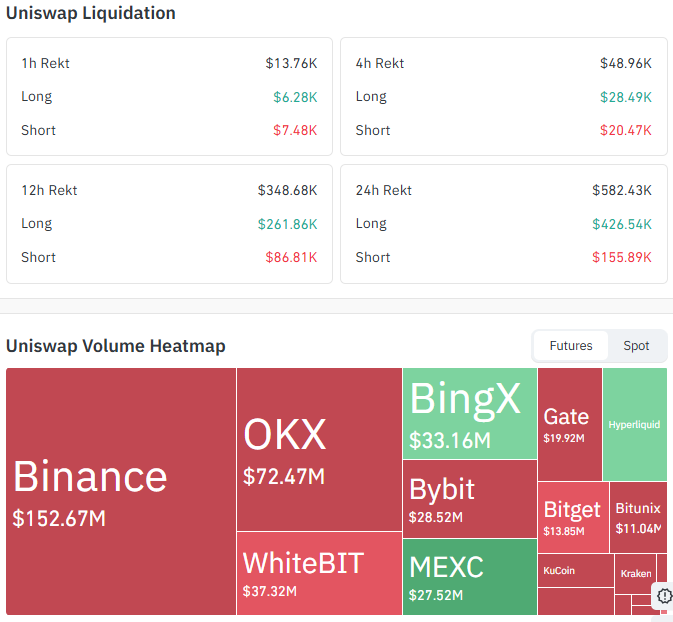
On the futures volume side, Binance leads by a wide margin at $152.67M, followed by OKX at $72.47M, with smaller volume spread across WhiteBIT, BingX, Bybit, MEXC, Gate, Bitget, and Bitunix (data via Coinglass).
$UNI Sees Exchange Outflows: Crypto News Today
Trader CW flagged $UNI among a group of coins, alongside SUSHI, ILV, and FET, that saw net outflows from Binance, framing exchange outflows as a bullish signal since it can suggest coins are moving into longer-term holding.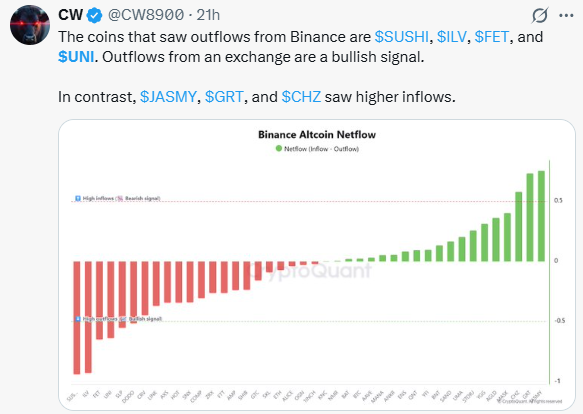
Source: Data From X
The same post noted JASMY, GRT, and CHZ saw higher inflows by contrast.
UNI Price Prediction Chart: Technical Analysis
Pair: UNI/USD · Market: Spot (Crypto index) · Timeframe: 1D · Timestamp: September 14, 2026, 07:07 UTC-3
UNI trades at $6.3208, up 3.21% on the candle, breaking out of a long, multi-month rounding-bottom structure, with converging long-term trendlines pointing toward resistance near $12.0060.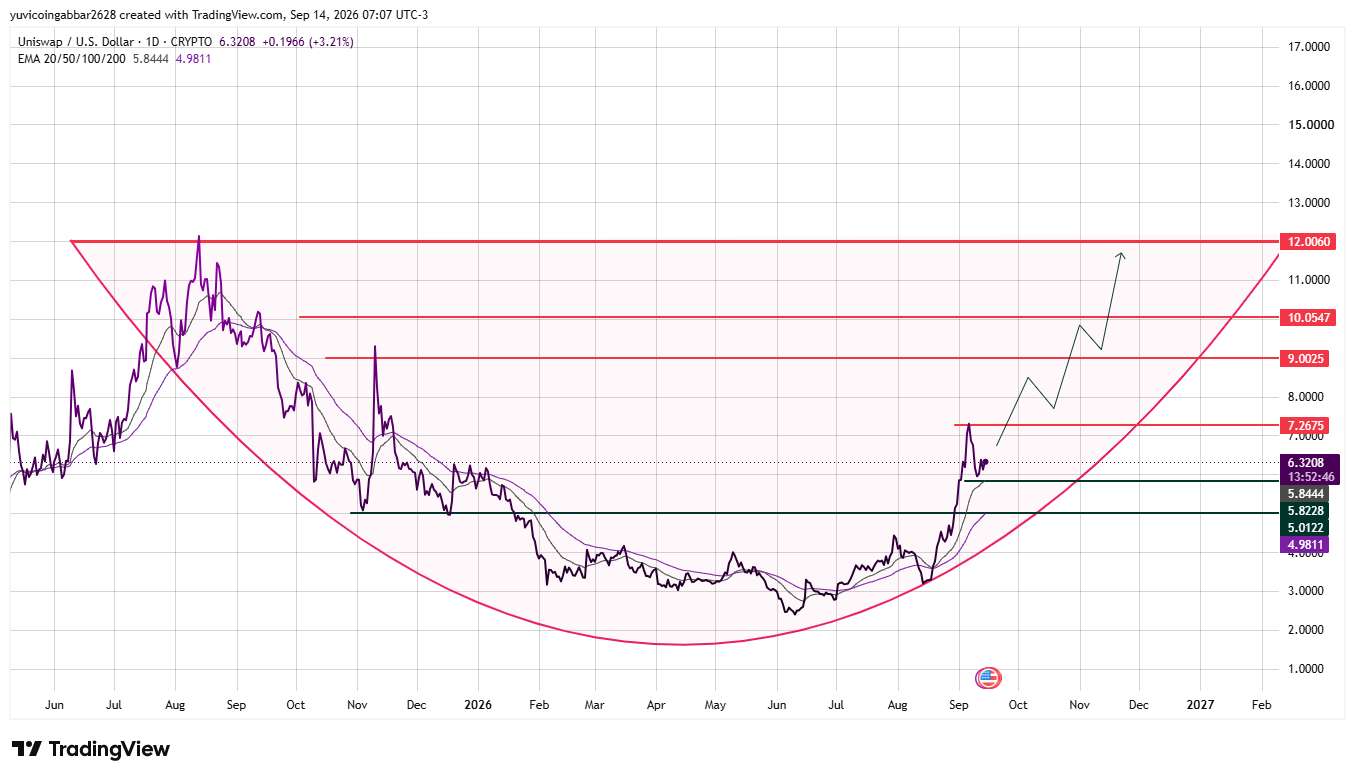
Uniswap Key Levels to Watch: Support and Resistance Outlook
Level Type
Price
Resistance 4
$12.0060
Resistance 3
$10.0547
Resistance 2
$9.0025
Resistance 1 (nearest)
$7.2675
Immediate Price Reference
$6.3208
First Confirmed Support
$5.8228
Deeper Support
$5.0122
Uniswap Forecast: Bull Case vs Bear Case
Bull case: Clearing $7.2675 would open the path toward $9.0025 and then $10.0547, with exchange outflows and the trendline breakout thesis both adding to the bullish case.
A sustained move could eventually test the $12.0060 zone flagged by the long-term chart pattern.
Bear case: A close below $5.8228 would expose $5.0122, and losing the EMA cluster near $4.9811 to $5.8444 would put the trendline breakout in question, especially with long liquidations picking up over the past 24 hours.
Uniswap Triggers and Invalidation
Scenario
Trigger
Likely Outcome
Invalidation Point
Resistance breakout
Close above $7.2675
Push toward $9.0025
Rejection back below $6.3208
Support hold
Bounce from $5.8228
Range continues toward resistance
Close below $5.8228
Support breakdown
Close below $5.8228
Slide toward $5.0122
Reclaim of $5.8228
Can UNI Reach $12.0060?
$12.0060 is the highest resistance marked on the chart, where the chart's long-term converging trendlines also meet.
Getting there would require UNI to first clear $7.2675, then $9.0025 and $10.0547 in turn, a multi-stage move that would need sustained demand well beyond today's breakout.
Uniswap News: UNI Trendline Breakout: Trader Targets $15.70
Trader on X laid out a technical setup on UNI's daily chart, noting the price has already broken its long-term descending trendline and is holding above rising support from recent lows. 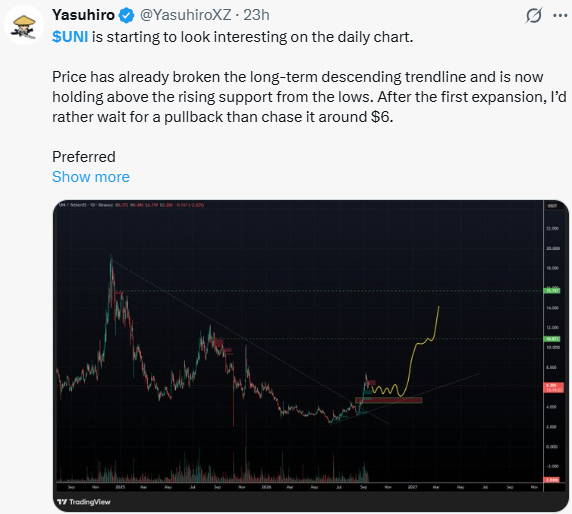
The plan favors waiting for a pullback into a $4.40 to $4.80 accumulation zone rather than chasing price around $6, with a stop-loss below $3.80 and two targets: $10.8 for TP1 and $15.7 for TP2, contingent on the higher-low structure and rising trendline continuing to hold.
Note: This is one trader's setup and Target are, not a guaranteed outcome.
Uniswap Price Prediction 2026: Expert View
According to CoinGabbar analysts, The trendline breakout and exchange outflow data both point to genuine bullish momentum, but rising long liquidations show the move isn't without risk.
The $5.8228 to $7.2675 zone is what matters most this week.
Disclaimer
This piece is for informational purposes only and isn't financial advice. The levels and scenarios above are based on technical chart analysis and publicly available data at the time of writing, and crypto markets can move sharply within hours, so past patterns don't guarantee future outcomes. It's worth doing independent research and considering your own risk tolerance before acting on any of the levels discussed here.