What to Know LEO has rebounded to $9.319 after briefly falling below its lower Bollinger Band, showing buyers are attempting to regain control. RSI stands at 42.72, reflecting recovering mome
What to Know
- LEO has rebounded to $9.319 after briefly falling below its lower Bollinger Band, showing buyers are attempting to regain control.
- RSI stands at 42.72, reflecting recovering momentum but remaining below its signal line and the neutral 50 level.
- Reclaiming the $9.608 middle Bollinger Band could strengthen LEO’s recovery and support a longer-term advance toward the $15 price target.
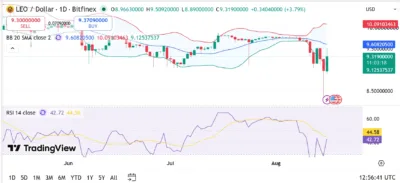
UNUS SED LEO (LEO) is attempting to recover from a steep selloff on the daily chart, with the token trading around $9.319 following a 3.79% gain. The latest candle shows buyers stepping in aggressively after LEO briefly plunged below the lower Bollinger Band, creating the possibility of a short-term recovery.
TradingView data shows LEO opened near $8.966 before reaching an intraday high of approximately $9.509. However, the token remains below its 20-day Bollinger Band average, suggesting the broader technical structure has not yet returned to bullish territory.
The recent volatility follows a period of relatively stable trading around the $9.60–$9.80 region. Selling pressure subsequently pushed LEO lower, although the latest rebound indicates demand remains present around the recent lows.
Also Read: Ontology (ONT) Price Prediction 2026–2030: Can ONT Hit $0.10?
Buyers Attempt Recovery From Lower Bollinger Band
LEO’s Bollinger Bands highlight the importance of its latest rebound. The middle band, representing the 20-day simple moving average, currently stands at approximately $9.608, while the upper and lower bands sit near $10.091 and $9.125, respectively.
Price briefly dropped beneath the $9.125 lower band before recovering to $9.319. Such a move can indicate that selling pressure became stretched, although a sustained recovery would require buyers to push LEO back above the middle Bollinger Band.
The $9.608 level therefore represents the immediate technical barrier. A successful reclaim could open the door toward the upper Bollinger Band around $10.091. Conversely, renewed selling below $9.125 could expose the recent lows and weaken the recovery structure.
Technical Outlook
The Relative Strength Index currently reads 42.72, while its signal line stands around 44.58. Although RSI remains below the neutral 50 level, it has recovered considerably from the recent oversold region visible on the chart. This improvement suggests bearish momentum is easing, but buyers still need stronger follow-through before LEO can establish a convincing bullish trend.
A move above $9.608 would provide an important technical confirmation and could place $10.091 back within reach. Breaking above $10.091 could strengthen the medium-term outlook, while failure to defend $9.125 may produce another period of downside volatility.
Source: Tradingview
LEO Price Prediction (2026–2030)
YearMinimumAverageMaximum2026$8.50$9.80$11.002027$9.20$11.00$12.802028$10.50$12.50$15.002029$11.80$14.00$17.002030$13.00$16.00$20.00
Price Forecast by Year
2026
If LEO successfully reclaims the $9.608 middle Bollinger Band and maintains support above the recent lows, the token could trade between $9.80 and $11.00 during the year.
2027
Improving market momentum and sustained buying pressure could help LEO establish support above $10 and potentially challenge the $12.80 region.
2028
A stronger cryptocurrency market combined with continued demand could support a move toward $15, marking an important long-term psychological milestone.
2029
If LEO maintains its broader upward structure, stronger accumulation could push the token toward $17 while establishing higher support levels.
2030
Under favorable market conditions, LEO could potentially reach $20, although achieving this target would require sustained demand and a significant expansion from current prices.
Conclusion
LEO is showing early signs of recovery after briefly falling below its lower Bollinger Band. The rebound to $9.319 indicates buyers are defending lower prices, while the RSI recovery to 42.72 suggests bearish momentum has started weakening.
However, LEO remains below its 20-day moving average at $9.608, making that level critical for the next phase of price action. A successful breakout could bring $10.091 into focus and strengthen the longer-term recovery outlook.
If LEO eventually establishes a sustained bullish structure above $10, the token could gradually approach the $15 milestone during the 2028 period. A break below $9.125, however, would increase downside risks and delay the bullish scenario.
FAQs
1. Is LEO currently bullish?
LEO is recovering, but the broader technical structure remains cautious because price is still below the 20-day Bollinger Band average near $9.608.
2. What does LEO’s RSI indicate?
The RSI stands at 42.72, showing momentum has recovered from recent oversold conditions but remains below the neutral 50 level.
3. What are the major resistance levels?
Immediate resistance sits around $9.608 at the middle Bollinger Band, followed by approximately $10.091 at the upper Bollinger Band.
4. Can LEO reach $15?
LEO could potentially reach $15 by 2028 if it establishes a sustained uptrend, breaks above current resistance levels, and broader market conditions remain supportive.
5. What risks could limit LEO’s upside?
Failure to reclaim $9.608, another decline below the $9.125 lower Bollinger Band, weaker buying pressure, or broader cryptocurrency market weakness could delay LEO’s recovery.
Also Read:https://36crypto.com/syrup-syrup-price-prediction-2026-2030-can-syrup-hit-0-50/Syrup (SYRUP) Price Prediction 2026–2030: Can SYRUP Hit $0.50?
The post UNUS SED LEO (LEO) Price Prediction 2026–2030: Can LEO Hit $15? appeared first on 36Crypto.