US crude oil has moved higher today, and the timing lines up closely with a fresh warning about the country's dwindling strategic reserves. This US oil price prediction looks at both the tech
US crude oil has moved higher today, and the timing lines up closely with a fresh warning about the country's dwindling strategic reserves.
This US oil price prediction looks at both the technical setup and the reserve data behind today's move.
WTI Crude Oil, tracked through CFDs on the FXCM exchange, serves as the primary US benchmark for crude oil pricing and reflects broader supply and demand dynamics across the domestic energy market.
Movements in WTI are closely watched by traders as an indicator of both economic activity and geopolitical risk tied to oil supply.
The US oil price today stands at $93.52 per barrel, up 1.67% on the day.
The move comes as traders digest new data on the state of the country's emergency oil supply.
Live Market Data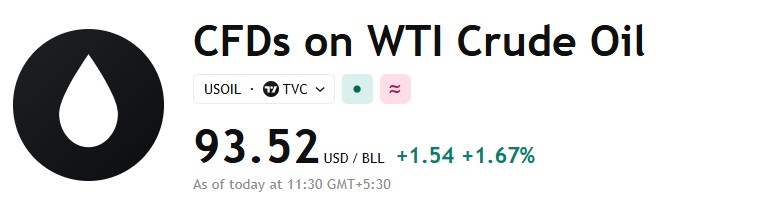
Source: TradingView, as of September 22, 2026, 11:38 UTC+5:30
US Oil News Today: Reserves Fall To Lowest Since 1982
According to the Kobeissi Letter, inventories in the US Strategic Petroleum Reserve fell by roughly 400,000 barrels last week, bringing the total to 284.6 million barrels, the lowest level since 1982. 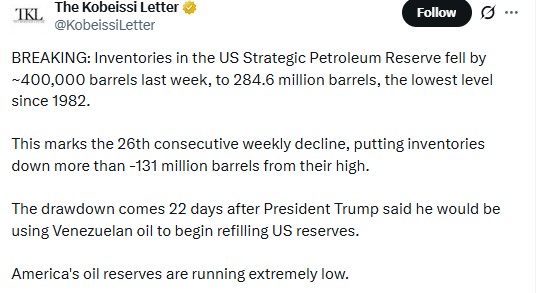
Source: Data Taken From @KobeissiLetter, X Account, as of Sep 22, 2026
The report noted this marks the 26th consecutive weekly decline, with reserves now down more than 131 million barrels from their peak.
The drawdown comes despite an earlier statement from President Trump that Venezuelan oil would be used to begin refilling US reserves, a plan that has yet to reverse the ongoing decline.
This kind of sustained reserve depletion is often read by traders as a supply-side signal, since lower emergency stockpiles can leave the market more sensitive to future supply disruptions.
Today's price gain suggests at least part of the market is factoring in this US oil news as a contributing factor alongside the technical bounce from oversold levels.
Technical Analysis: WTI Breaks Descending Channel, Tests Resistance
On the 4-hour chart, WTI had been trading inside a descending channel through most of September before breaking below the channel's lower boundary.
Since that breakdown, the price has stabilized and is now moving up to test resistance levels. 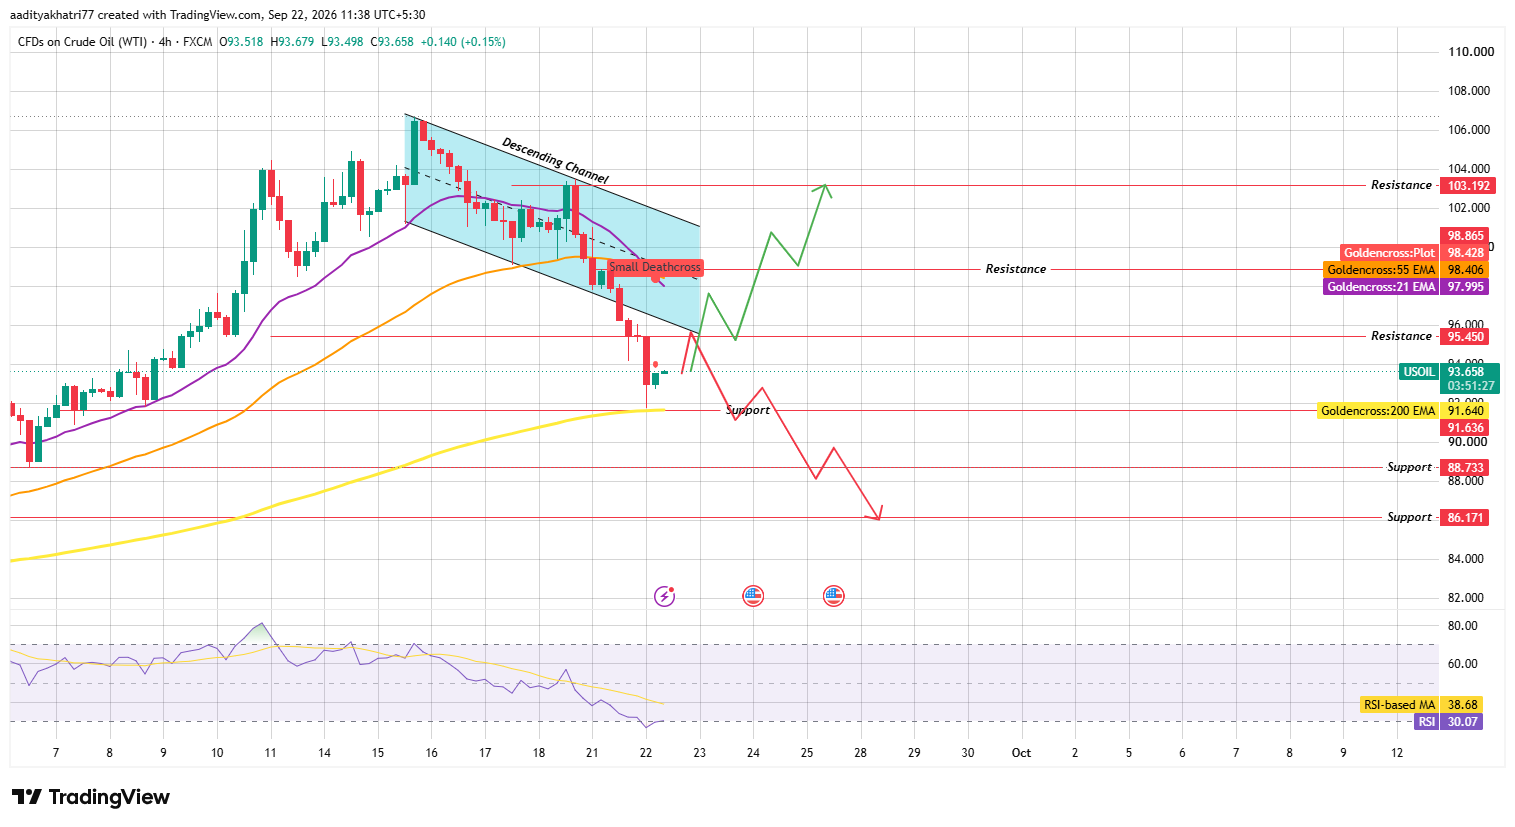
Source: Chart taken from TradingView, as of Sep 22, 2026
A small death cross recently formed between the 21 EMA and 55 EMA, reflecting the bearish pressure that dominated the prior decline.
RSI sits at 30.07, in oversold territory, with its moving average at 38.68.
Can WTI Push Toward Higher Resistance?
If the price breaks above the $95.450 resistance level, the next hurdle is the EMA cluster near $97.995 to $98.865, where the 21 EMA, 55 EMA, and a golden cross plot converge.
A confirmed move through this zone would open the path toward $103.192.
This scenario would mark a meaningful reversal from the recent downtrend and align with the bullish reading many traders are taking from the reserve data.
What Happens If WTI Is Rejected?
If the price fails at resistance and turns lower, the first level to watch is $91.640, which coincides with the 200 EMA, making it a technically significant support zone.
A break below both the support level and the 200 EMA would expose $88.733, and continued selling could extend the decline toward $86.171.
Given the RSI's oversold reading, a bounce attempt before any further breakdown would not be unusual.
Support and Resistance Levels
Support
Resistance
$91.641 (200 EMA)
$95.450
$88.733
$98.428
$86.171
$103.192
Bull, Base, and Bear Scenarios
Scenario
Setup
Level
Bull
Break the above resistance and EMA cluster.
$98.865 - $103.192
Base
Price consolidates between support and resistance.
$91.640 - $95.450
Bear
Rejection and breakdown below 200 EMA support
$88.733 - $86.171
Methodology
This US oil price prediction September 2026 analysis is based on 4-hour candlestick data for CFDs on WTI Crude Oil from FXCM, sourced through TradingView, combined with live pricing data.
Support and resistance levels are drawn from the descending channel structure and EMA cluster visible on the chart. RSI readings are used to assess momentum and identify oversold or overbought conditions.
All figures reflect data captured as of September 22, 2026, and are subject to change as trading continues.
Expert Opinion
Energy market analysts have flagged the Strategic Petroleum Reserve's continued decline as a factor that could add upward pressure on oil prices if the trend persists without meaningful refilling.
Whether this translates into a sustained rally depends on whether WTI can hold above the $91.640 support zone and confirm a break through resistance, rather than the reserve data alone driving price action.
Disclaimer: This article is for informational purposes only and should not be considered financial advice. Commodity markets are highly volatile, and prices can move sharply in either direction. The scenarios outlined above are based on current chart patterns and are not guaranteed outcomes. Readers should conduct their own research and consider their risk tolerance before making any investment decisions.